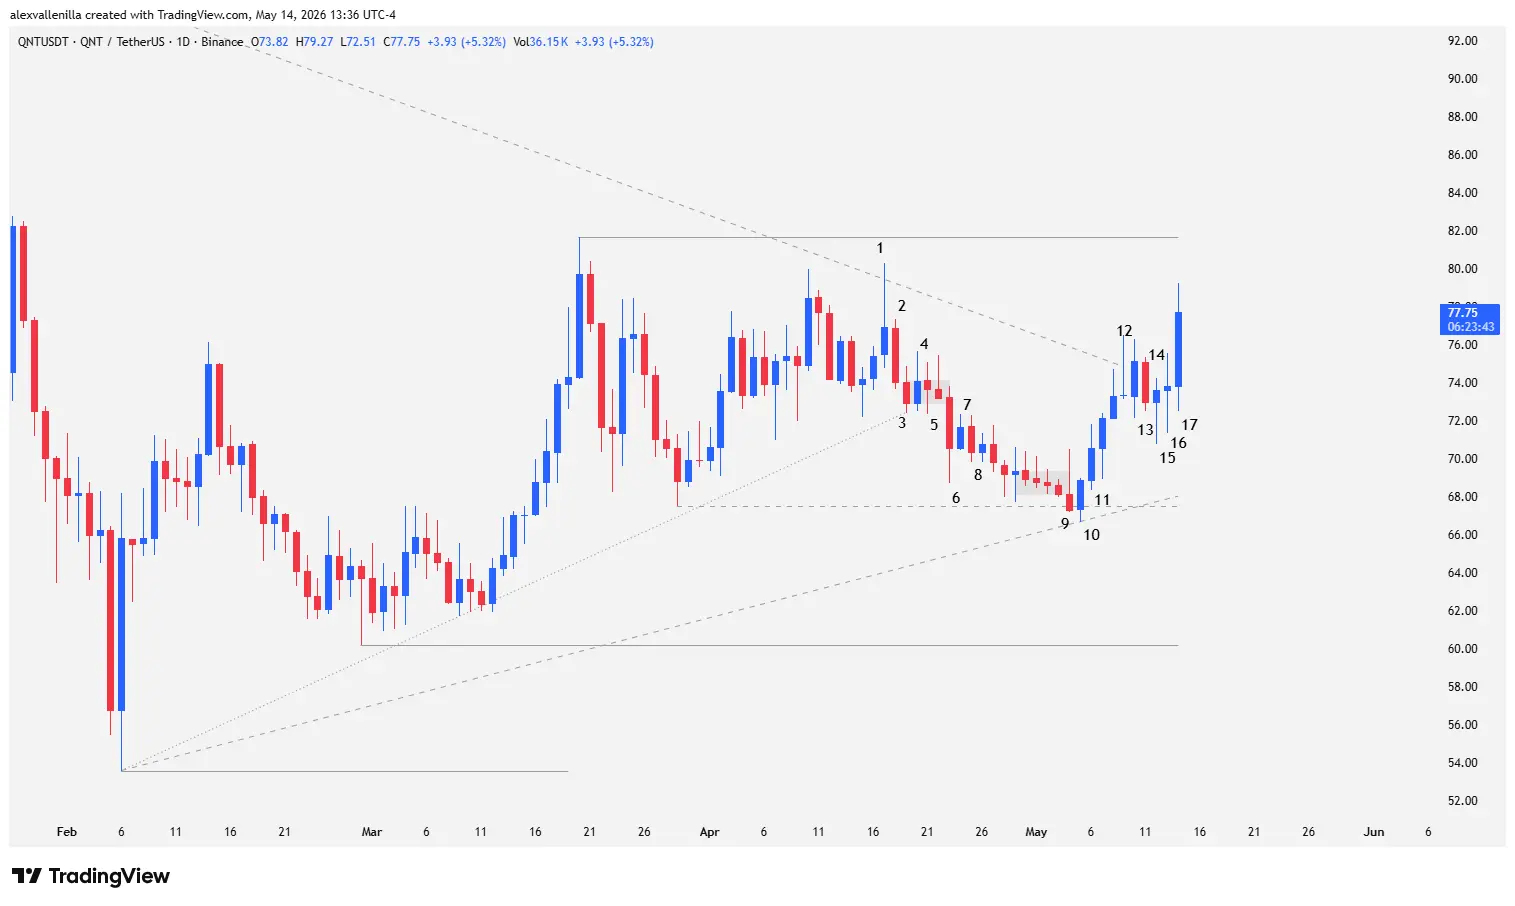
The cryptocurrency market is closely watching Quant (QNT), which is currently trading at $77.75. After an extensive period of bearish dominance lasting 290 bars, the asset is attempting a structural breakout for the second time. Between buyer traps and increasing volatility, QNT is boxed into a decisive range between $67.53 and $81.66, while flow indicators suggest a pitched battle between supply and demand on the daily chart.
The Trend Labyrinth: Between Failures and Micro-channels
Quant‘s current narrative is not linear. The asset is attempting to shake off the weight of nearly 300 days of declines by forming a 97-bar bullish counter-trend micro-channel. However, this ascent hit a dynamic “wall.”
From a pedagogical perspective, the price is compressed. On one hand, higher lows inject optimism; on the other, technical resistance at $81.66 (the last relevant high) acts as a psychological and technical ceiling that bulls have yet to demolish. This compression is often the prelude to explosive moves, known in trading as a “breakout crisis.”
Technical Analysis: The 17-Bar Battle
To understand the “why” behind the current price action, we must break down the price movement bar by bar, identifying the inflection points where market sentiment shifted:
Bar 1: The first major warning. It was a rejection pin bar with an upper wick that doubled its body. It acted as a trap; although it pierced the trendline, it did not close above it and formed a double top at the $81.66 resistance.
Bars 2 and 3: Confirmation of the failure. Bar 2 pushed the price back into the bearish channel, while Bar 3 set up a sell signal (Low 2), eventually triggered by Bar 5.
Bar 6: A critical test. A sharp drop was absorbed by buyers, leaving a long lower wick that respected the $67.53 support, proving that bears were losing conviction.
Bar 9: Volatility “awakening.” A bearish outside bar threatened to collapse the price by briefly breaking support, but it ended up being a bear trap.
Bars 10 to 13: The counterattack. Bar 10 trapped the bears, and Bar 13 finally achieved a milestone: closing above the 290-bar downtrend, albeit with structural weakness.
Bar 16: A massive doji that invalidated previous bearish attempts and kept the price afloat.
Bar 17 (Current): With a partial gain of 5.32%, this bar is responsible for confirming the breakout. By surpassing the highs of bars 12 and 13, the market validates the shift in bias, though the real goal remains consolidating above the $81.66 level.
Where is QNT Heading?
If Quant manages to close convincingly above the $81.66 zone, the path clears to target the $108 resistance. Conversely, failing to overcome this ceiling would keep the asset in a sideways range, with $67.53 support serving as the last line of defense before resuming the long-term bearish cycle.
Disclaimer: This analysis is for informational and educational purposes only. It does not constitute financial advice. Cryptocurrency investments carry high risk. Conduct your own research before trading.
Communications Professional. Crypto Enthusiast. Economic Journalist. Bitcoiner & Altcoiner.