DEXE caught the attention of the fintech ecosystem following an aggressive 82-bar rally that culminated in a breakout above $13.63 resistance. This move isn’t just a price fluctuation; it represents a formal attempt to flip a long-term bearish structure into a solid recovery narrative. However, after hitting a high of $16.24, the asset entered a technical congestion phase that is testing the nerves of younger traders. Are we looking at a necessary breather before a move to $24, or definitive exhaustion?
Technical Analysis: The Battle for $16.24 and the Broadening Pattern
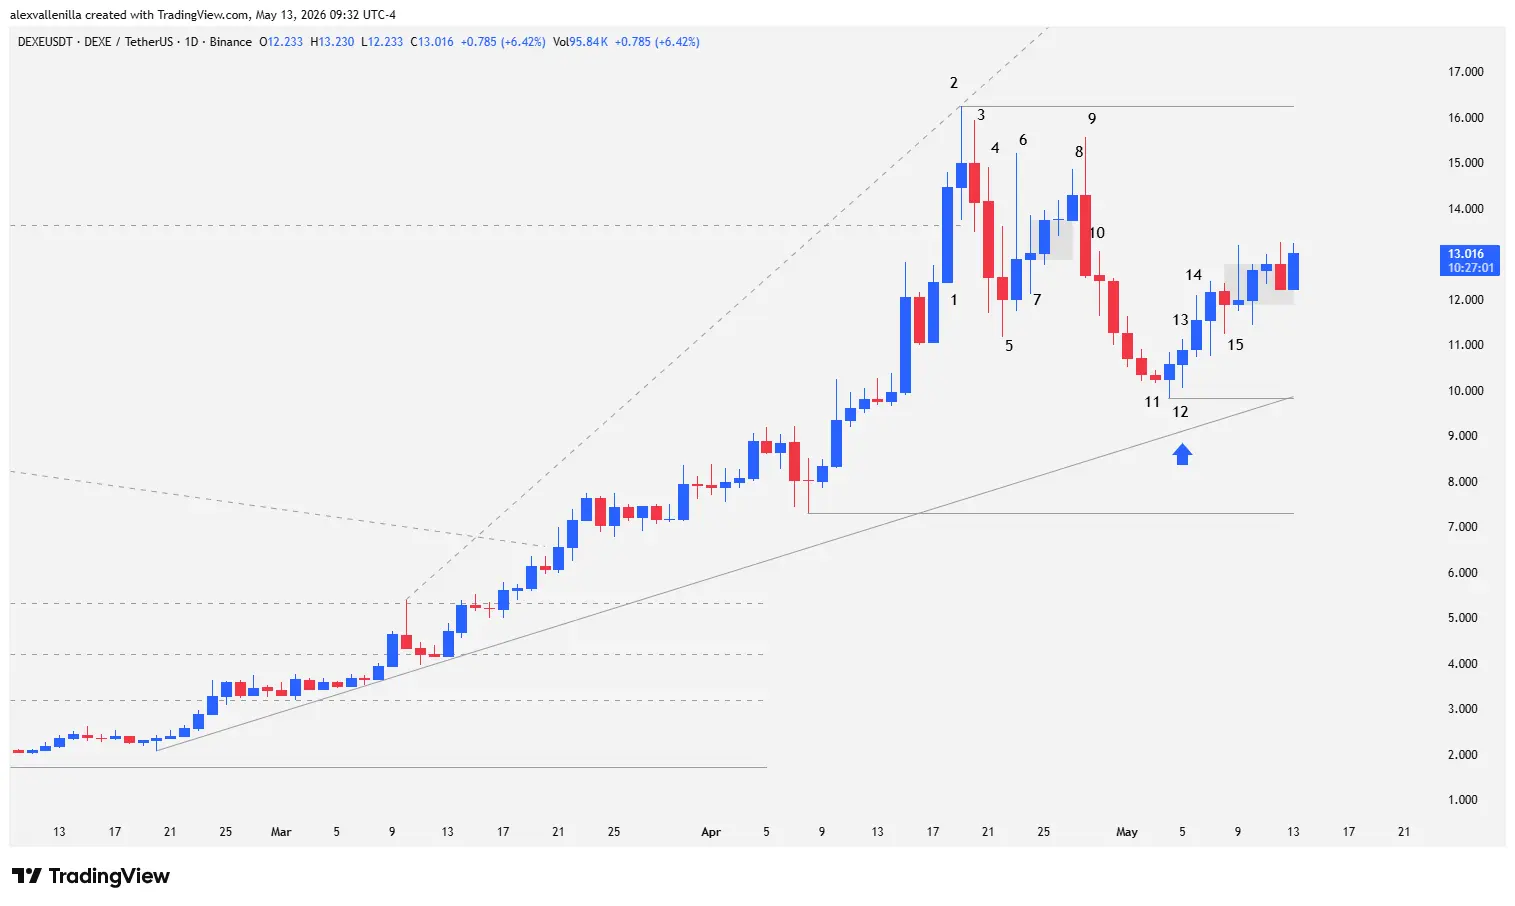
DEXE‘s behavior on the daily chart (1D) reveals a narrative of constant struggle between bullish conviction and strategic profit-taking. Below, we break down the price action bar by bar:
The Momentum and Resistance (Bars 1 to 3)
Bar 1: The trigger. A breakout bar closing above $13.63, taking out the most relevant lower high of the previous downtrend.
Bar 2: A doji marking indecision after the effort. It established technical resistance at $16.24, a point that now serves as the ceiling of an ascending broadening wedge.
Bar 3: Confirmed the pause. A weak reversal that failed to clear the previous high, opening the door for sellers.
The Pullback and Deceleration (Bars 4 to 11)
Bar 4: A solid 11.67% drop, piercing the low of Bar 1 and returning volatility to the market.
Bar 6: A bullish pin bar. Although buyers tried to regain control by trapping bears, selling pressure was enough to leave a long upper wick.
Bars 7 to 9: The market entered a state of confusion. Bar 9 was a bearish “outside bar” that engulfed the previous range, showing aggressive supply.
Bars 10 and 11: Crucial for the analysis. We saw a deceleration in the decline (smaller bodies). Bar 11 failed to touch the ascending trendline, suggesting bears ran out of steam before reaching dynamic support.
The Bounce and Current Setup (Bar 12 to Present)
Bar 12: Stopped the bleeding, establishing fixed support at $9.819.
Bars 13 and 14: Triggered a High 2 buy signal. While the bar bodies remain small, clearing previous highs confirmed a moderate bounce.
Current Context: At the time of this report, DEXE trades at $13.016 (up 6.42%). Price is currently trapped in a “barbed wire” congestion zone, waiting for a volume catalyst.
The $24 “Magnet”
DEXE sits at a structural crossroads. The broadening wedge suggests we could still see two or three additional bullish pushes. If price breaks $16.24 with strength, the next technical objective (or “magnet”) sits at $24.19, the peak of the original downtrend. Conversely, losing the $9.81 support would invalidate this thesis, returning the asset to a prolonged accumulation zone.
Disclaimer: This analysis is for informational and educational purposes only. It does not constitute financial advice. Investing in crypto assets involves high risk.
Communications Professional. Crypto Enthusiast. Economic Journalist. Bitcoiner & Altcoiner.