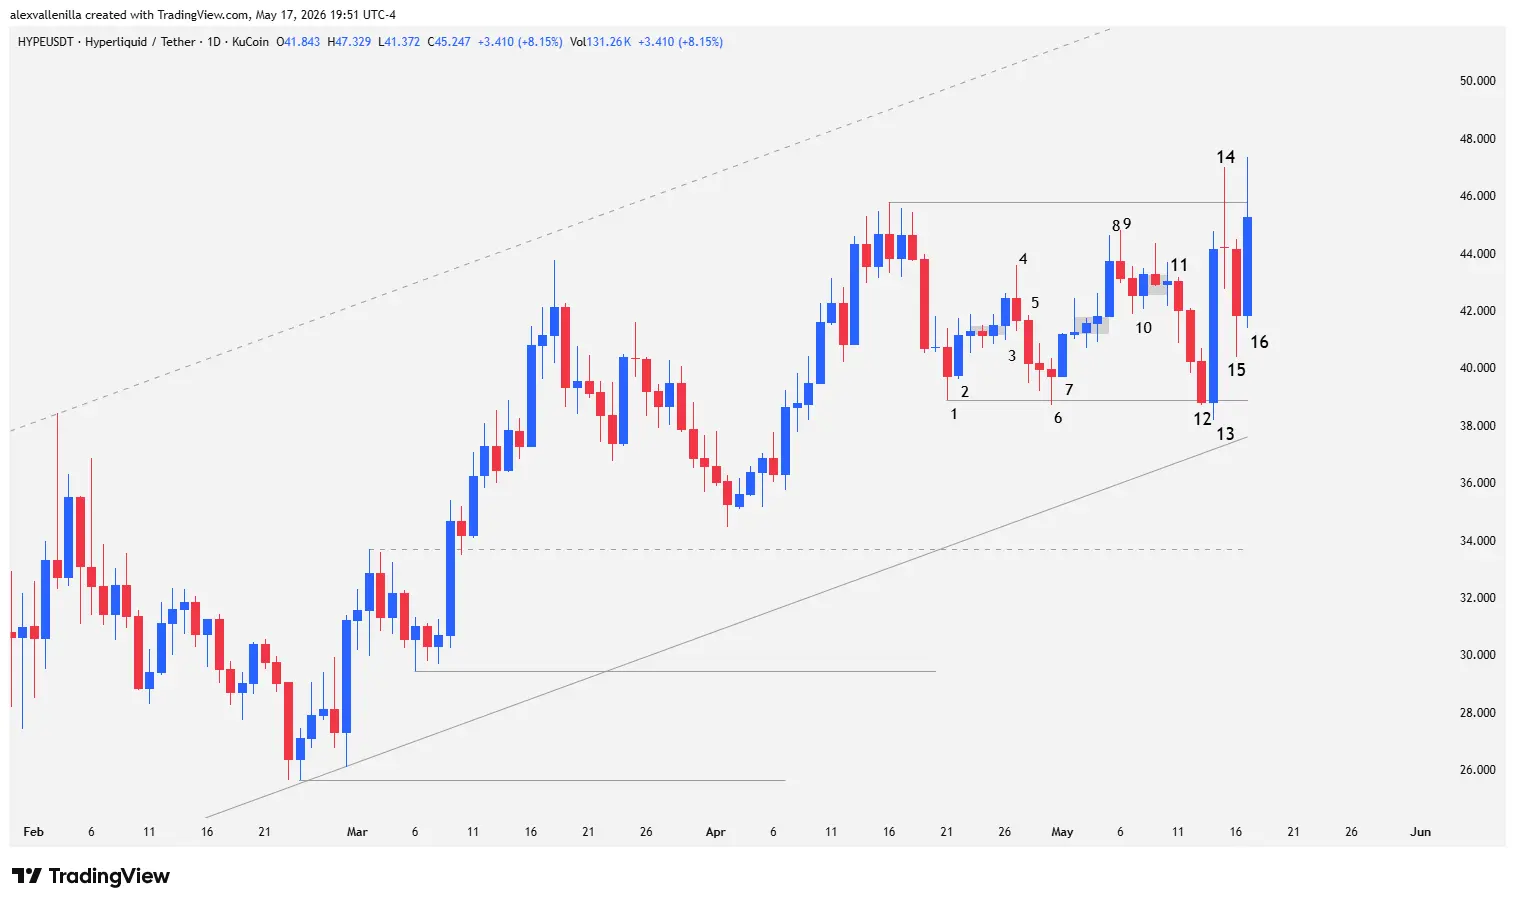
Institutional buyers are strongly defending HYPE’s bullish structure on the daily (1D) chart in mid-May 2026. After experiencing extreme volatility and getting caught in a consolidation range between $38.89 and $45.77, the cryptocurrency is looking to secure a definitive bullish breakout. The confluence of a long-term ascending channel and aggressive supply absorption suggests the market is gearing up to push the price toward its all-time highs, defying previous retail exhaustion.
The Battleground: Consolidation Within the Ascending Channel
HYPE’s price maintains a solid uptrend on the daily timeframe. Price action currently confines trading to a range defined by firm support at $38.89 and persistent resistance at $45.77. This sideways movement is playing out right inside a 116-bar macro ascending channel, signaling that the asset is undergoing a necessary accumulation and cooling-off phase before aiming for another major bullish impulse. Although bears attempted to break the dynamic structure, market “strong hands” stepped in aggressively to protect the dominant trend.
Detailed Technical Analysis: Anatomy of the Price Action
Here, we break down the chart’s technical narrative through the sequential behavior of its last sixteen sessions:
Bar 1: Establishes a fundamental initial support at $38.89 during a controlled market pullback.
Bar 2: Immediately halts bearish continuity. Buyers lift the session low above the previous support and break above Bar 1’s high. This reaction stops the drop, though the price subsequently enters a sideways congestion phase over the next three sessions.
Bar 3: Decisively breaks the previous compression pattern via a solid impulse in favor of buyers.
Bar 4: Introduces signs of exhaustion. Bears react, forming a candle with an upper shadow equal to its body size due to notable profit-taking. The bar’s high fails to approach resistance at $45.77. Since this point marks the third bullish push within the 116-bar macro channel, the failure to test the upper band raises weakness alarms.
Bar 5: Confirms the previous session’s corrective bias, extending the sell-off.
Bar 6: Prints a bearish pin bar with a pronounced lower wick following a prior doji, confirming that sellers are losing momentum. The bar’s low slightly pierces Bar 1’s key support before bouncing.
Bar 7: Brings absolute conviction back to the buy side via a robust bullish candle with virtually no wicks. The low respects the base support and leads into a tight congestion structure known in technical analysis as “barbed wire.”
Bar 8: Breaks the sideways compression thanks to buying pressure, printing a 4.58% climactic rally from Bar 6’s support. However, it leaves a gap ahead of resistance at $45.77 and leaves an upper shadow that betrays the halt in momentum.
Bar 9: Acts as a bearish reversal pin bar. Its upper shadow confirms technical exhaustion after the previous climactic impulse.
Bar 10: Extends the decline in favor of the bears, dragging the price into a new stagnation zone.
Bar 11: Breaks the congestion range to the downside. Although the lower wick reveals that buyers are absorbing some of the sell orders, the subsequent candle validates the drop by closing below its low.
Bar 12: Severely threatens the overall bullish structure by closing below support at $38.89. However, the session low finds pinpoint support on the trendline defining the lower boundary of the 116-bar channel.
Bar 13: Triggers a macro market reversal. Institutional capital aggressively floods in, generating a massive 13.71% bullish candle that completely traps Bar 12’s sellers. The session records minimal wicks and sends volatility skyrocketing, confirming the fierce defense of the primary trend.
Bar 14: Introduces confusion via a wide-range doji with no real body. High volatility allows it to pierce resistance at $45.77 for the first time, but buyers fail to sustain the advance, and the price closes below that mark.
Bar 15: Consolidates the rejection at resistance with a 5.32% drop. Despite the pullback, the lower shadow extends beyond the halfway point of the candle body, proving that latent demand continues to absorb supply above initial support.
Bar 16: Actively trading at $45.24 at the time of this report, printing partial gains of 8.15%. This energetic move invalidates the previous session’s bearish pressure, lifts its low, and pierces resistance at $45.77 once again. Current behavior shows that strong-hand buyers are successfully defending the confluence between static support and the macro channel trendline.
Conclusion: The Next Step for HYPE
The fierce battle on HYPE’s daily chart proves that institutions will not easily surrender control of the trend. If the price consolidates an effective daily close above $45.77, it will definitively invalidate the sideways structure and target the channel’s dynamic resistance at $54. A breakout above this level will activate the primary macro target at $60, an area that coincides with its all-time high and acts as a powerful technical magnet. Conversely, another failed daily close will force the asset to retest the base of the range at $38.89.
Disclaimer: This analysis is presented solely for informational and educational purposes. It does not constitute financial advice or an investment recommendation. Crypto asset markets exhibit high volatility; conduct your own research before risking capital.
Communications Professional. Crypto Enthusiast. Economic Journalist. Bitcoiner & Altcoiner.