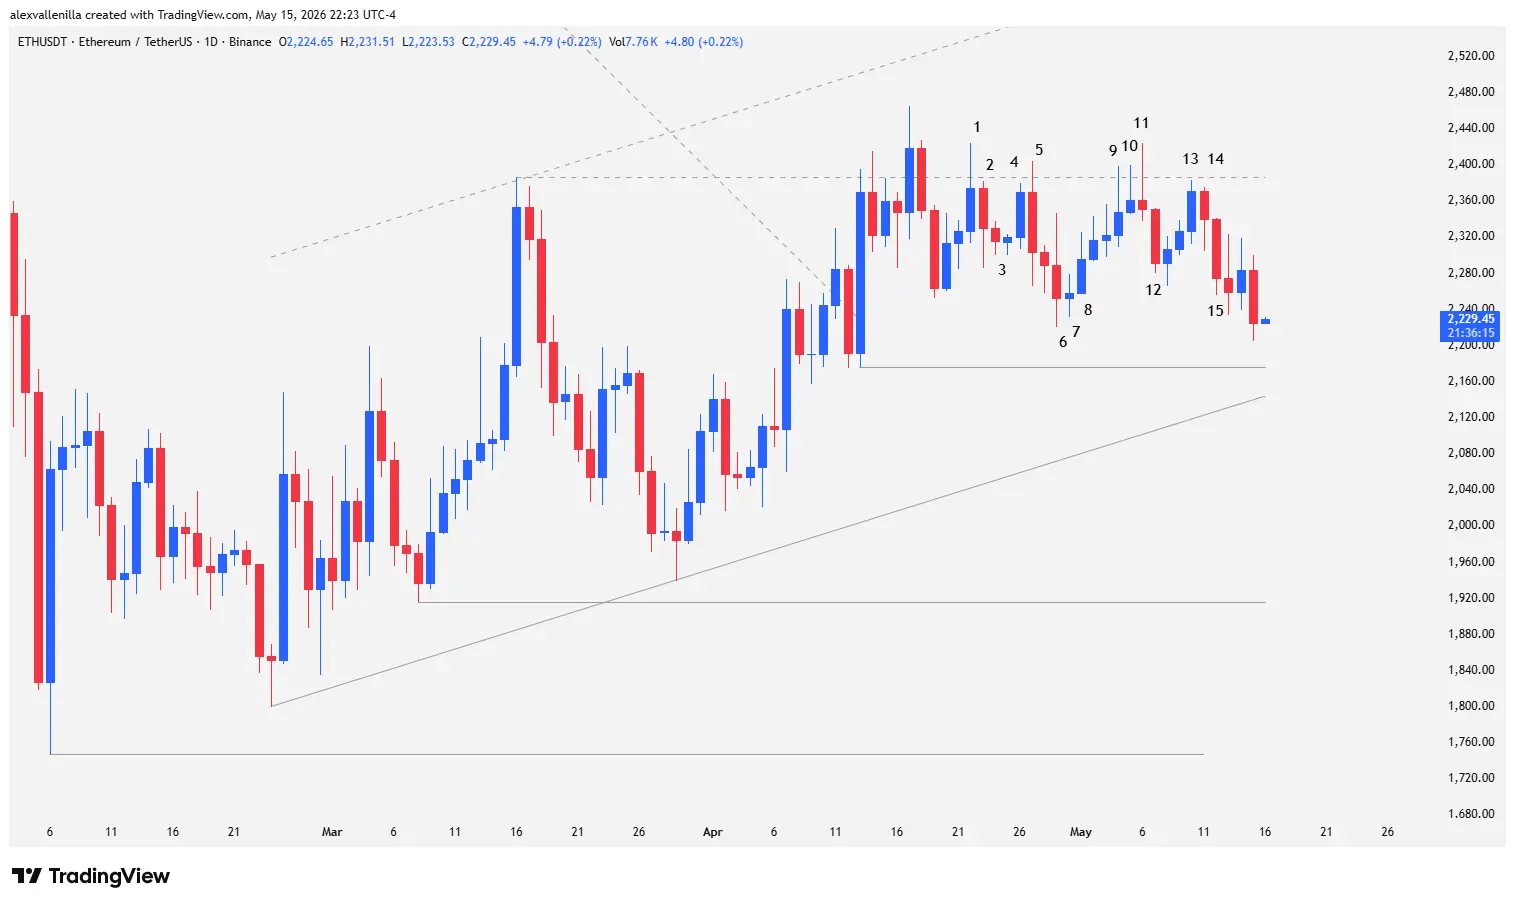
The Ethereum (ETH) market is experiencing a notable loss of momentum after closing Friday at $2,205, registering a -2.57% contraction. Despite breaking a prolonged 188-bar downtrend via a previous ascending channel, buyers face an insurmountable wall. Price action now consolidates into a “Spike and Range” technical pattern structured between key support at $2,175 and technical/psychological resistance at $2,386. This sideways accumulation phase reveals a fierce battle where bears successfully defend higher prices, boxing ETH into a critical transition zone.
Market Transition: From Ascending Channel to Sideways Consolidation
Ethereum‘s recent dynamics demonstrate how market structures shift gears drastically. The breakout from the primary downtrend, which dominated the daily chart for 188 bars, flashed bullish signals for investors thanks to an 81-bar ascending channel. However, that initial momentum is progressively fading.
Currently, price highs are moving further away from the upper boundary of the ascending channel. This technical behavior highlights a clear loss of strength on the demand side. Instead of maintaining a linear upward trajectory, ETH is mutating into a “Spike and Range” structure—a classic transitional pattern that typically harbors institutional orders before defining the crypto asset’s next macro move.
Detailed Technical Analysis: A 15-Bar Breakdown on the Daily Chart
To understand buyer exhaustion and the supply counterattack, we analyze the numerical sequence of the last 15 bars on the daily (1D) timeframe:
Bar 1: A bullish candle executes the second failed attempt to break the $2,386 resistance. Although the high momentarily pierces the zone, bears defend the area and print a sharp upper tail. By failing to surpass the high of the first historical attempt, Bar 1 completes a pullback following the previous trendline breakout.
Bar 2: A bearish candle confirms the failed breakout. Price formally returns below resistance due to a lack of buying continuity.
Bar 3: This prints as a bearish inside bar with a very small body. Sellers show initial difficulty pushing the price lower, leading to another consecutive inside bar.
Bar 4: Bulls attempt to push the market again, but a lack of liquidity and volume prevents them from even testing the resistance.
Bar 5: A wide-range bearish outside bar triggers volatility. Its high pierces $2,386 again, but the close sits below the low of Bar 4, trapping late buyers and confirming another rejection at the resistance zone.
Bar 6: Another bearish outside bar maintains high volatility and extends the decline. Despite the negative move, the low fails to test critical support at $2,175 (the origin of the previous bullish breakout).
Bar 7: An inside bar forming a small bullish Doji. It halts the continuity of Bar 6 and traps exposed sellers, confirming the boundaries of the sideways range and validating the accumulation phase.
Bar 8: Provides bullish continuity to Bar 7. It triggers a chain of green candles with small bodies and pronounced tails, denoting a low-conviction recovery.
Bar 9: Forms a bullish Pin Bar with an extensive upper shadow. The high penetrates $2,386, but supply repels the move, forcing a lower close.
Bar 10: An inside bar and Pin Bar that repeats the rejection scenario against fierce bearish defense.
Bar 11: The third consecutive Pin Bar, this time with a bearish close. Bulls seek a breakout, but sellers dominate the daily close, leaving an extremely long upper wick compared to its tiny real body.
Bar 12: A solid-bodied bearish candle validates the triple rejection of the previous bars and drives the decline forward. A slight pullback follows.
Bar 13: A moderate-range bullish candle attempts to approach resistance but fails.
Bar 14: A bearish bar with a lower wick, demonstrating buyer resistance to giving up ground. Its lower high confirms control of the retracement.
Bar 15: Continues the selling pressure. Price charts a two-legged downward move that aims directly at testing the bottom of the trading range.
Breakout Scenarios and Price Targets
Ethereum’s current technical confinement sets up two clear outcomes for the coming weeks, depending on which side of the range breaks first:
The Bullish Scenario: Destination $2,600
If buying volume returns and ETH manages to break the $2,386 resistance with a solid daily close, price will target the $2,600 zone. The upper boundary of the original 81-bar ascending channel converges at this level, acting as a powerful technical magnet. Overcoming this mark would open the door to building a solid medium-to-long-term uptrend.
The Bearish Scenario: Danger at $1,920
Conversely, if the current two-legged downward move pierces support at $2,175, Ethereum will simultaneously lose the bottom of the range and the lower side of the ascending channel. This breakdown would invalidate the accumulation structure and project a larger correction toward the next macro support, located at $1,920.
Ethereum sits at a distributional crossroads. The “Spike and Range” pattern demonstrates that while bears no longer have the strength to sink the market to new lows, bulls lack the fuel needed to sustain prices above $2,386. The resolution of this range will determine whether the breakout of the 188-day trend was a genuine cycle change or simply a breather before a deeper correction.
Disclaimer: The information presented in this article does not constitute financial advice, investment recommendations, or formal securities analysis. Trading crypto assets involves a high risk of capital loss. Every reader must conduct their own research (DYOR) before making financial decisions.
Communications Professional. Crypto Enthusiast. Economic Journalist. Bitcoiner & Altcoiner.