Volatility is shaking MicroStrategy Inc. (MSTR) on the NASDAQ tech market following the release of its latest earnings report on May 5, 2026. The software company registered net losses well above analysts’ estimates, injecting uncertainty into Wall Street. However, price action on the daily chart contradicts the initial panic: institutional investors are strongly defending key support zones and setting up an accumulation structure that challenges the traditional bearish bias, opening the door for a potential macro reversal.
Earnings Impact: The Numbers Behind the Market Noise
MicroStrategy’s corporate front presented discouraging figures for the conventional investor. The earnings report posted a result of -$38.25 per share, compared to an initial analyst estimate of -$0.86. This gap represents a negative surprise of -$37.39, which equals a 4,337.35% deviation.
In any other software corporation, a miss of this magnitude would trigger a massive stock sell-off. However, the market evaluates MicroStrategy through a different lens due to its massive Bitcoin treasury. Fluctuations in the cryptocurrency directly impact its financial statements, causing accounting losses that do not always reflect operating cash flow or underlying strategic value. For this reason, smart money ignores the headline noise and focuses directly on price action.
Technical Analysis: A Detailed Battle Between Bulls and Bears
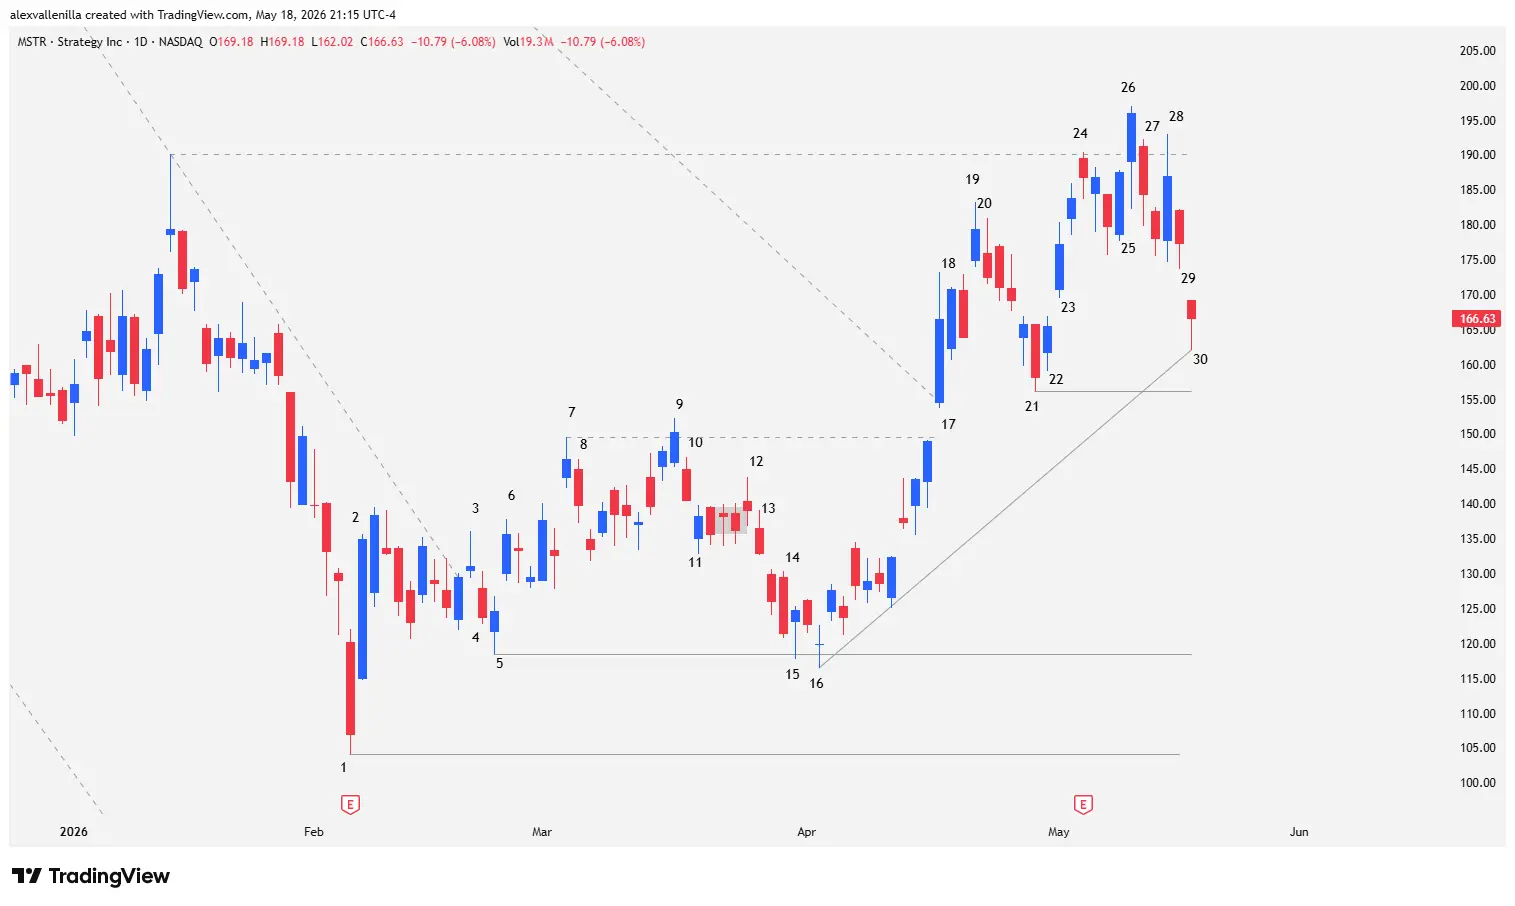
To understand the true direction of MSTR stock, we must dissect the chart’s narrative bar by bar. Price is drawing a methodical transition from selling exhaustion to building a new bullish structure.
Phase 1: Supply Exhaustion and Institutional Bounce
Bar 1: A climatic candle closes with a sharp -17.12% drop at the end of a prolonged bearish cycle. The market interprets this oversold condition as the definitive exhaustion of the bears. This session’s low establishes critical support at $104.17.
Bar 2: Institutional buyers enter the market immediately. This strong bullish bar prints a 26.11% gain. It opens halfway up the previous body and leaves no lower shadow (wick), demonstrating absolute conviction that absorbs remaining supply. By closing more than halfway above the high of Bar 1, it halts the decline completely and drags the price into a sideways consolidation.
Bar 3: A small bullish-closing pin bar prints with a pronounced upper wick and an almost nonexistent body. Despite its size, it manages to break the trendline of a minor downtrend that spanned 93 bars.
Bar 4: A small bearish session emerges in response. Sellers defend dynamic resistance and temporarily halt the continuation of the previous breakout, attempting to regain macro control.
Bar 5: Bulls frustrate the bearish plan via a small bullish doji. By halting Bar 4’s decline, this move confirms that the previous pullback failed. The session prints a higher low at $118.40, consolidating a higher floor relative to Bar 1.
Bar 6: Buying pressure resumes with force. Bulls print a new blue bar with a gap up from the previous session, fully validating the breakout of the 93-bar downtrend.
Phase 2: Range Construction and Liquidity Traps
Bar 7: Price marks a new local high at $149.54. Although this move beats the tops of Bars 6 and 3, it introduces a “peak and range” pattern that keeps price action within a major 188-bar downtrend.
Bar 8: A bearish pullback appears, giving way to a sideways congestion phase.
Bar 9: Bulls try to follow through on the upward momentum. Although they manage to close above Bar 7 resistance, the advance is barely noticeable.
Bar 10: Bears exploit the weakness of the previous breakout. They print a pullback bar that drops the price back below local support, setting up a failed breakout.
Bar 11: A small bullish candle stops the descent. Although its high and close sit below the low of Bar 10, the session efficiently absorbs supply in the lower zone of the range.
Bar 12: Buyers attempt to break out of the congestion to the upside but fail, closing in negative territory and leaving a long upper tail.
Bar 13: The market punches the previous bullish failure with a small bar that breaks the short-term structure to the downside.
Bar 14: Bears show their strength with a solid -3.64% drop. The session features a solid body, lacks significant wicks, and leaves a bearish gap relative to Bar 13’s low.
Bar 15: Buyers appear near the edge. A small bullish pin bar slightly pierces the key support of Bar 5, but bulls quickly absorb the selling and save the zone.
Bar 16: A doji of confusion forms, testing the Bar 5 support again. According to price action psychology, when the market fails twice consecutively to hit a target (in this case, breaking down support), the opposite move usually occurs. This double bearish failure attracts massive buying.
Phase 3: Major Trend Breakout and Role Reversal
Bar 17: Institutions return with a power not seen since Bar 2. This massive bullish candle decisively breaks above the upper line of the primary 188-bar descending channel and simultaneously wipes out the $149.54 resistance. The upper wick reveals logical profit-taking after such an extension.
Bar 18: Price catches its breath via an inside bar of consolidation, holding onto the previous session’s gains.
Bar 19: Buying pressure pushes price above Bar 18 but loses steam before testing critical resistance at $190.20 (the last relevant high of the macro structure).
Bar 20: A lack of volume at the highs creates a bull trap. Bears take temporary control and confirm the start of a corrective process.
Bar 21: Sellers extend the correction with a solid, consistent bar. However, the decline fails to touch the old resistance at $149.54, establishing a new floor at $156.11.
Bar 22: An inside bullish candle halts the sellers’ momentum and traps short sellers by breaking above the previous high.
Bar 23: The session confirms the bullish reversal and pushes price back toward the upper area of the chart.
Bar 24: Price momentarily pierces the $190.20 resistance, but sellers reject the move and force a close below the specified level.
Phase 4: The Current Battle at the Key Zone
Bar 25: Bulls react with a solid 4.31% advance. The candle prints a firm body with no wicks, stopping the previous correction immediately.
Bar 26: MSTR finally manages a technical breakout of $190.20 via a bullish pin bar. Half of its range trades above the resistance, but its long lower wick betrays high volatility in the conflict zone.
Bar 27: Bears reappear and trap early buyers. The session closes below $190.20, dictating another failed breakout.
Bar 28: Bulls execute a second breakout attempt. Despite achieving a notable 5.02% intraday gain, the session prints a massive upper wick and closes below key resistance once again.
Bar 29: A bearish pullback bar validates the resistance and confirms the frustration of the previous breakout.
Bar 30: Price undergoes a -6.08% daily correction, placing MSTR’s close at $166.63. Despite the declines, the session prints a bearish pin bar with a fairly long lower wick that respects the $156.11 support (Bar 21). This higher low allows drawing a new ascending trendline that already boasts 31 bars of validity.
Market Outlook: Scenarios for MSTR
Despite recent pullbacks and the impact of the quarterly balance sheet, the technical outlook favors buyers. Upward impulses show greater speed and volume than bearish corrections—behavior characteristic of institutional accumulation phases.
Bullish Scenario: If buyers manage to consolidate the price above $190.20, the market will validate the macro structural shift. A measured move based on the previous range projects an initial target at $231.00. If optimism holds, the next long-term resistance lies at $365.21.
Bearish Scenario: If panic over corporate earnings breaks the current trendline and the Bar 21 support at $156.11 gives way, MSTR could slide back down to hunt for liquidity in the institutional support zone located at $118.40.
MicroStrategy’s technical resilience demonstrates that the market is transitioning from a harsh corporate winter toward a structural recovery phase. Although the May 5 earnings report sowed superficial doubts, the defense of higher lows and the breakout from the 188-bar descending channel suggest that strong hands are positioning their portfolios for the next major tech expansion cycle.
Disclaimer: This article is for informational and educational purposes only. It does not constitute financial advice, investment recommendations, or an offer to buy or sell shares of MicroStrategy Inc. (MSTR). Trading high-volatility financial assets carries a significant risk of capital loss.
Communications Professional. Crypto Enthusiast. Economic Journalist. Bitcoiner & Altcoiner.