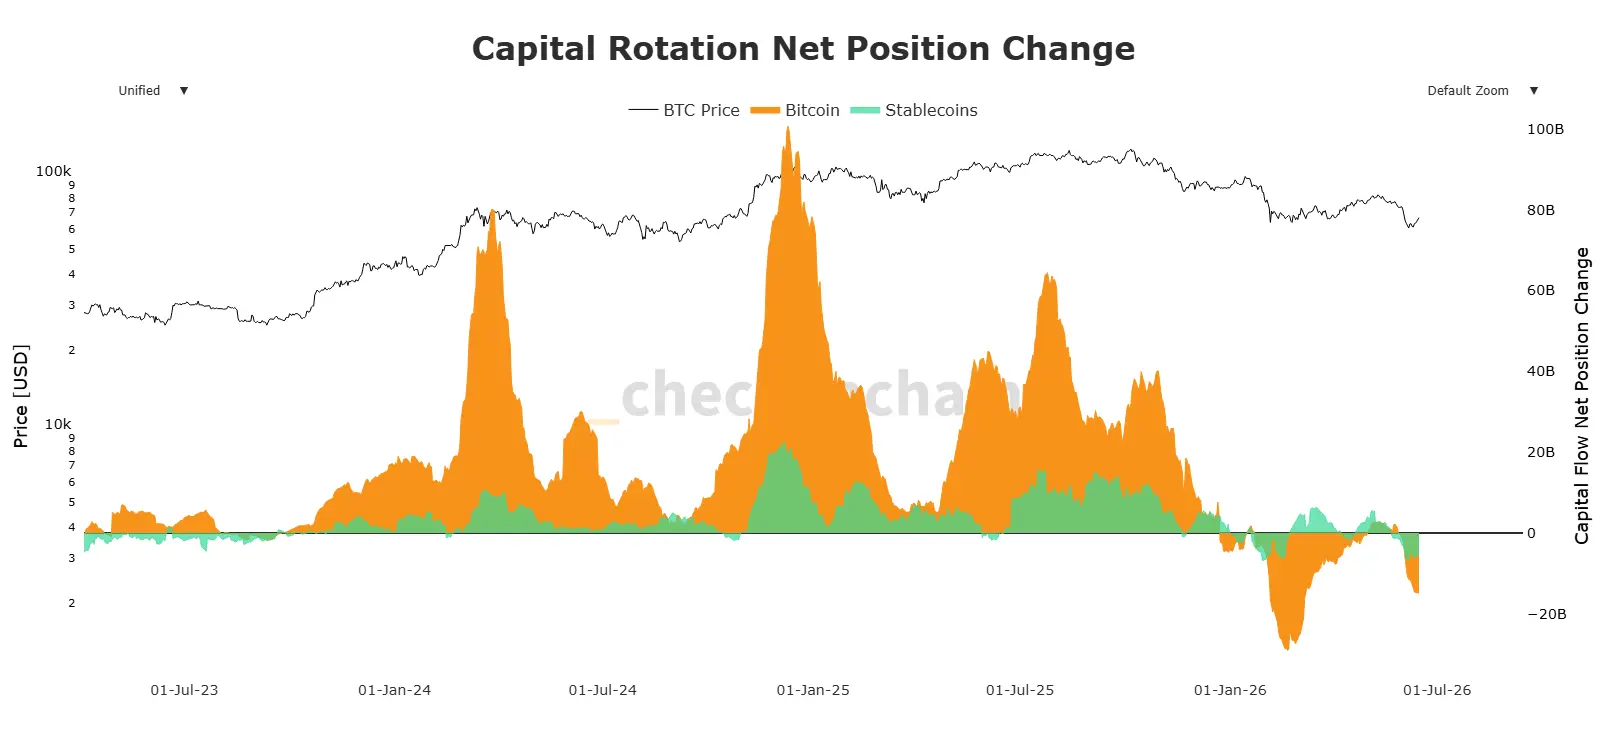
The macroeconomic crypto landscape shows a structural trend reversal. After hitting all-time highs, institutional flows into bitcoin and stablecoins have entered negative territory. According to the latest data from the Checkonchain platform, the change in global capital net position reflects a combined contraction exceeding $20.5B. This highlights that investors are taking chips off the table in the short term while the spot price consolidates around $66,833.75.
From Euphoria to Distribution: The Capital Journey
To understand the current state of the market, analyzing how bitcoin capital flows moved over the last few months through three key milestones is essential:
| Date | Bitcoin Price | Bitcoin Net Flow | Stablecoin Net Flow | Market Condition |
|---|---|---|---|---|
| Oct-29-25 | $110,840.07 | +$40.09B | +$9.42B | Peak euphoria and massive injection. |
| Feb-20-26 | $67,735.70 | -$29.02B | -$1.53B | Capitulation and severe profit-taking. |
| Jun-15-26 | $66,833.75 | -$14.83B | -$5.68B | Consolidation with moderate liquidity drain. |
The Peak of Greed (October 2025)
In late October 2025, the Bitcoin network experienced one of its greatest boom eras. With the asset trading above $110,800.00, bitcoin capital flows were overwhelmingly positive, registering over $40B in net inflows into the currency and $9.42B into stablecoins. This indicated latent purchasing power and blind confidence in the continuation of the bull run.
The Great Institutional Exodus (February 2026)
The situation pulled a 180-degree turn early this year. On February 20, 2026, as the asset retraced to the $67,735.70 zone, on-chain data sounded the alarm: a massive $29.02B outflow in bitcoin. Institutional investors and whales executed historic profit-taking, converting their positions into fiat currency or exiting the ecosystem entirely.
On-Chain Analysis: What Does the Current Picture Imply?
At the close of this report, the Capital Rotation Net Position Change chart shows that the primary bleeding has slowed down, but the negative sign persists. The bitcoin metric stands at -$14.83B, while stablecoins record an outflow of -$5.68B.
On-Chain Education: When both Bitcoin and stablecoin flows drop simultaneously into negative territory, it means capital is not “rotating” (i.e., investors are not selling their bitcoin to wait it out in digital dollars). Instead, capital is leaving the blockchain rails entirely, heading toward the traditional banking system or legacy assets.
This lack of “dry powder” (stablecoins) on exchanges limits the potential for an explosive and immediate recovery, which explains why the price has moved sideways near the $66.8k resistance.
Future Outlook: Where Are We Headed?
The current behavior of bitcoin capital flows suggests that the market is searching for a solid macroeconomic floor. The reduction in capital outflows from -$29B (in February) to -$14.8B (in June) proves that selling pressure is losing steam.
If Bitcoin network technology continues to gain adoption and whales halt distribution, the return of stablecoin flows will be the first green shoot anticipating the next major bullish move. For now, patience remains the best on-chain strategy.
Disclaimer: This article is strictly informational and does not constitute financial advice or an invitation to invest. Crypto assets carry a high risk of volatility.
Communications Professional. Crypto Enthusiast. Economic Journalist. Bitcoiner & Altcoiner.