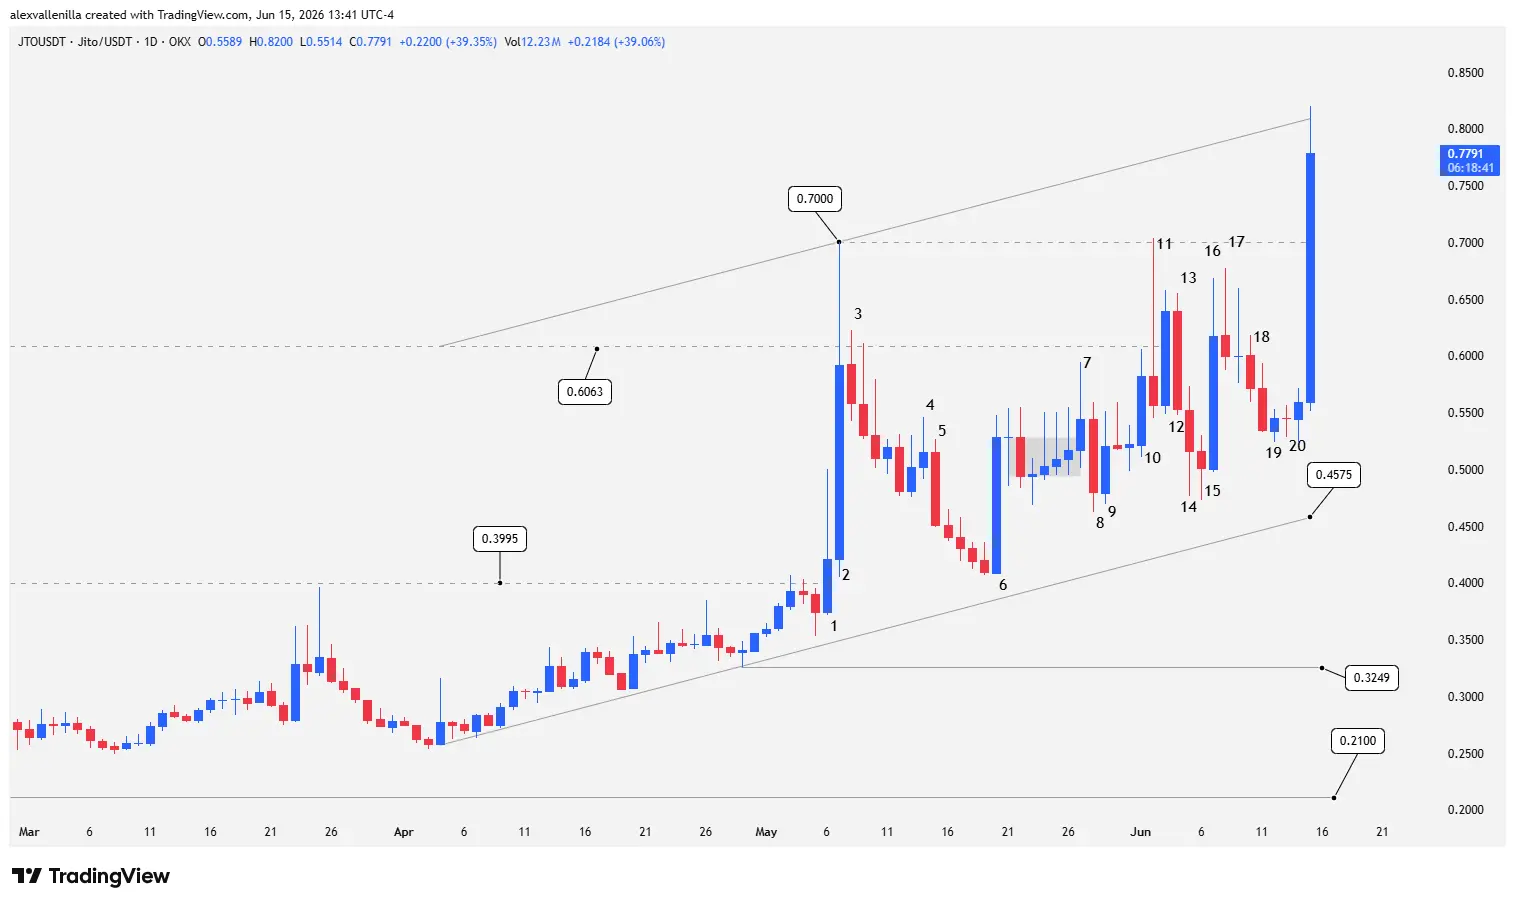
The digital finance market is witnessing a high-conviction institutional move on the JTO chart. Today, June 15, 2026, the asset violently broke out of a long-term ascending channel, trading at 0.7782 with an intraday return of +39.19%. This vertical acceleration liquidated short positions and pushed the price into a climatic overbought phase (*Buy Climax*), shifting the previous technical structure and opening the door to new macro targets.
The Origin of the Move: From Accumulation to a Sustained Channel
The architecture of the current chart reveals a flawless technical transition that professional traders classify as textbook. The price left a flat, horizontal trading range to initiate a structured expansion cycle.
Clearing the previous supply levels did not happen by chance; it was driven by consistent liquidity absorption that weakened historical sell walls. This process paved the way for a market geometry characterized by a well-textured, two-way channel, where supply and demand battled bar by bar, stepping up the asset’s value through dynamic higher lows.
Chart Chronology: Anatomy of the Price Action
Analyzing crowd psychology and order flow through clean Japanese candlestick reading allows us to break down the rally into five structural stages:
Initial Impulse and Level Testing (Bars 1 to 3)
Bar 1: A moderate bull trend bar manages to close above the psychological level and former resistance at 0.3995. This move marks the official breakout from the previous flat range.
Bar 2: Buyers unleash a massive, wide-range bull spike. The price pierces the historical 189-bar resistance located at 0.6063, but supply sweeps liquidity at the highs, leaving a prominent upper wick near 0.7000.
Bar 3: A large-bodied bear bar triggers an immediate counterattack by the bears. The market confirms that the previous vertical rally required order absorption before continuing.
The Correction and Continuation Trap (Bars 4 to 6)
Bars 4 and 5: Bar 4 makes a minor attempt to resume the upward move, but Bar 5 (a bear conviction bar) immediately invalidates it. The price slides into a micro-bearish cascade.
Bar 6: A critical turning point and high-conviction bar. Bears exhaust their strength and fail to establish a lower low relative to the origin of the impulse. Buyers defend the territory by printing a higher low, confirming the base of an ascending channel, though the close halts before retesting 0.6063 due to caution.
Transition Phase and Overlapping Channels (Bars 7 to 10)
Bar 7: The market temporarily enters a horizontal overlapping zone (Barb wire). Buyers attempt a breakout that stalls, leaving a long upper wick.
Bars 8 and 9: A classic shakeout occurs below the mini-range support. Bar 9 operates as a bear trap, clearing lower liquidity before bouncing strongly.
Bar 10: A strong response bull bar invalidates the previous failed downside breakout and officially resumes the primary channel structure.
The Sustained Ascending Channel (Bars 11 to 20)
Bars 11, 13, 16, and 17: This sequence prints higher highs. Wicks at the tops show partial profit-taking, giving the channel a healthy, two-way trading texture.
Bars 12, 14, 15, and 19: A perfect succession of higher lows. Demand aggressively defends every pullback before endangering the dynamic support trendline at 0.4575.
Bar 20: A small bullish inside bar rests with pinpoint precision on the channel support, serving as the final fuel accumulation.
The Current Bar: Climatic Breakout (Buy Climax)
The giant bar recorded today, June 15, 2026, completely redefines the technical structure of the asset. This is an Absolute Conviction Bullish Spike currently trading at 0.7782.
Price dynamics show that the session opened near its low (Bar 20) to wipe out the 0.7000 horizontal resistance in a single move, surpassing the high of Bar 3 and piercing the upper trendline of the 72-bar channel.
By breaking an ascending channel to the upside, the market enters a vertical acceleration phase. This phenomenon forces lagging short sellers to cover their positions through forced buying, mathematically fueling the momentum.
Structural Scenarios and Key Levels
With the price trading outside its normal trend bands, price action statistics present two immediate paths:
Retest Scenario (Higher Probability): Healthy profit-taking that causes a pullback toward the 0.7000 level. If this level executes a support/resistance flip from resistance to support, it will validate a major structural cycle shift for JTO.
Direct Continuation Scenario: The asset consolidates at the highs via narrow-range bars and inside bars over the next 1 to 3 sessions, before projecting the width of the broken channel toward a magnetic target in the 0.8500 – 0.9000 zone.
Safety Supports: Immediate support sits at 0.7000, while the lower structural base of the channel remains guarded at 0.4575.
The climatic breakout of JTO demonstrates the power of price action to anticipate massive imbalances between supply and demand. Institutional validation of the 0.7000 zone will determine whether we are witnessing the birth of a prolonged new bull cycle or an exhaustion climax that will require extended distribution.
Disclaimer: This analysis is presented strictly for informational and educational purposes. It does not constitute financial advice, investment recommendations, or an invitation to trade digital assets. Every trader must conduct their own research (DYOR).
Communications Professional. Crypto Enthusiast. Economic Journalist. Bitcoiner & Altcoiner.