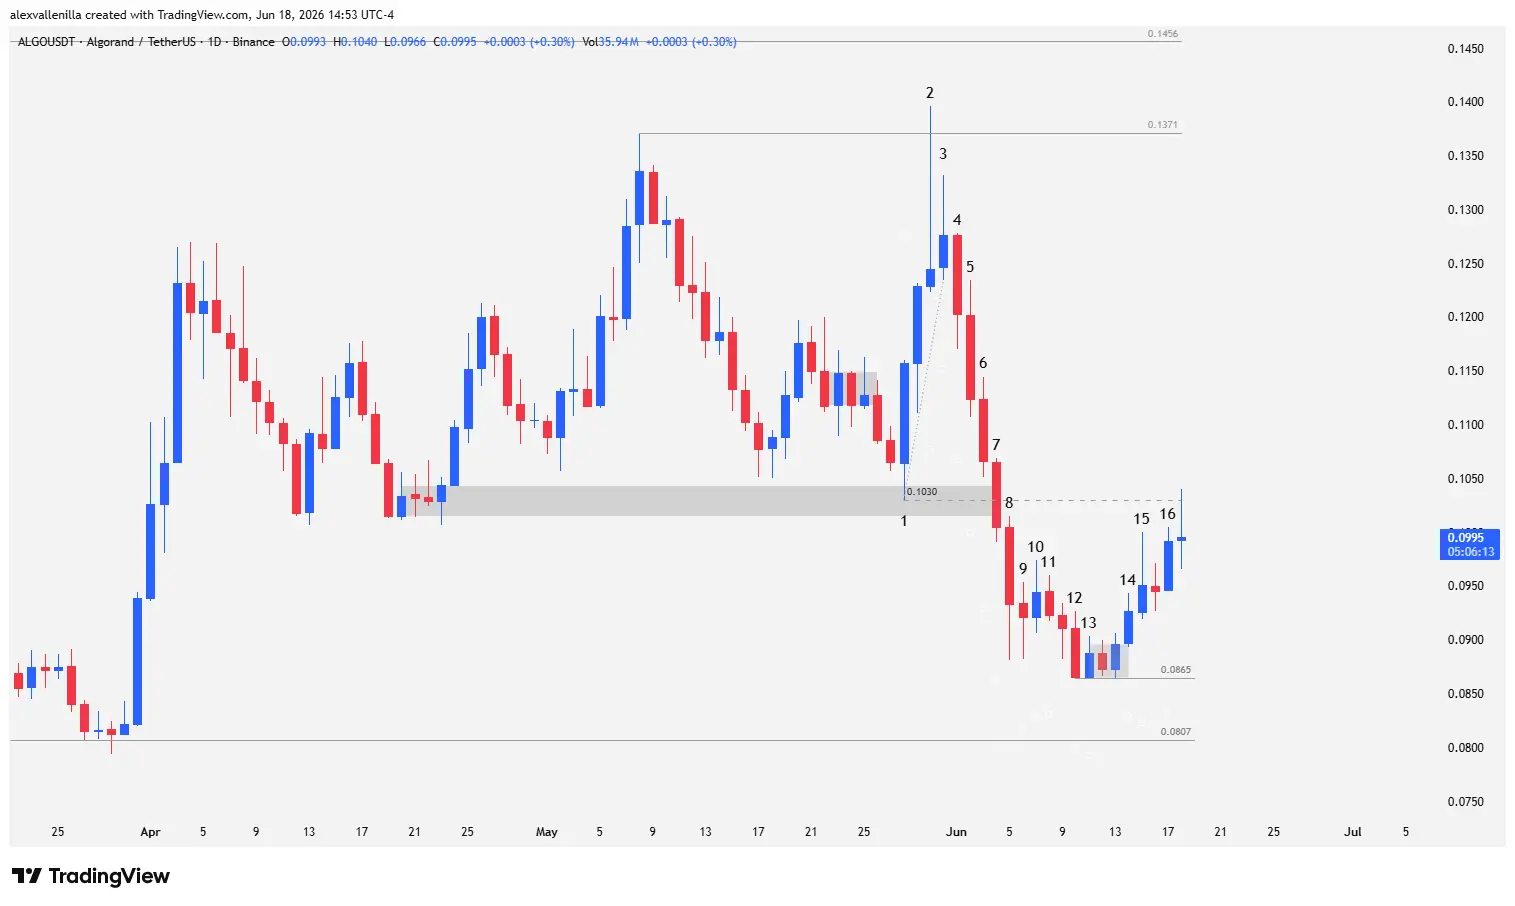
Algorand (ALGO) is facing a crucial moment in its daily market structure during 2026. After attempting a bullish breakout that excited the market, a violent wave of profit-taking by bears triggered a rejection at the $0.1371 resistance. This move invalidated the previous momentum, pierced key support levels, and forced the price to test the vicinity of its all-time lows. Despite the severe correction, buyers successfully defended structural support at $0.0807, keeping the asset inside a prolonged macro accumulation phase.
The $0.1456 Wall and Persistent Bearishness
The technical outlook for Algorand demonstrates that breaking a long-term downtrend is only the first step; the real challenge lies in building a sustainable bullish structure. To consolidate a new medium- or long-term cycle, ALGO must trade and hold above $0.1456, a level representing the last relevant lower high of its previous bearish cycle.
As long as price action trades below this threshold, the market will continue to deploy a “sell the rally” strategy. Institutional rallies will be used to liquidate long positions, keeping ALGO trapped inside a wide trading range. Nevertheless, recent behavior prints a higher low in the primary structure, confirming that demand actively absorbs supply at the bottom of the channel.
Price Action Technical Analysis
To understand trader psychology and the underlying order flow, we analyze in detail the numerical sequence of the last 16 candles on the daily (1d) chart:
The Bullish Climax and the Trap for Buyers
Bar 1: A high-conviction bullish candle. Its low rests precisely on a previous congestion zone that acted as a twice-tested support. The small lower wick demonstrates incoming buying pressure, establishing an operational floor at $0.103. By clearing the high of the previous bar, it triggered sellers’ stop-losses, accelerating the momentum.
Bar 2: A pinbar candle (inverted hammer) at the tail end of the parabolic move. Although the high pierced resistance at $0.1371, the session closed far from the highs, leaving a massive upper wick. Bears executed massive sell orders, blocking the breakout. As the second consecutive failure at this level, it formed a double top pattern and a bull trap. The failure to test $0.1456 confirmed structural weakness.
Bar 3: A consolidation candle. Its inability to exceed the high of Bar 2 confirmed the total loss of bullish momentum. The presence of an upper wick validated that bearish distribution remained active.
Confirmation of the Trend Reversal and Capitulation
Bar 4: Breaks the low of Bar 3 and cracks the bullish micro-channel of the parabolic move, formally validating the short-term trend reversal.
Bar 5: A formidable, wide-range bearish candle. It positions itself at the top of the general range as an optimal, high-probability short signal like a Low 2 (second failed attempt at a bullish resumption).
Bar 6: A continuity candle that formally triggers the short signal from the previous bar.
Bar 7: The fourth consecutive bearish candle. It reflects a “bears in a hurry” scenario (aggressive sellers). It pierces the previous support at $0.103 (the low of Bar 1), sweeping buyer liquidity and invalidating the protective congestion zone.
Bar 8: The fifth consecutive down candle, driving price into a climatic and overextended state (oversold conditions). Despite the free fall, the appearance of a long lower wick reveals that limit buy orders began absorbing the massive supply, protecting critical support at $0.0807.
Seller Exhaustion and the Current Bounce
Bar 9: An inside bar that halts the plunge and breaks the sequence of lower lows.
Bar 10: A failed bullish reversal attempt. It develops a small body that denotes weakness due to a lack of buying volume.
Bar 11: Another inside bar that fails to provide continuity to the high of Bar 10, inviting short sellers back into the market.
Bar 12: A bearish acceleration candle showing persistent selling into the close of the session, leaving an almost non-existent lower wick. However, as the final remnant of the bearish impulse since Bar 4, it acted as a capitulation candle. By failing to reach macro support at $0.0807, it left a gap that exposed bear exhaustion, establishing a higher low at $0.0865.
Bar 13: A narrow-range reversal candle that begins a three-bar accumulation zone at local lows.
Bar 14: Bulls break out of the micro-congestion range with a candle that exceeds the highs of sessions 12 and 13.
Bar 15: Confirms the breakout by closing above Bar 14, although the high finds dynamic resistance before reaching $0.103 (former support turned pivot resistance).
Bar 16 (Current Bar): Continues the recovery bias. During the session, it temporarily pierced the key resistance at $0.103, though price fluctuates just below this level ahead of the daily close.
Projections and Portfolio Impact
The historical behavior of Algorand reflects the harsh winter the asset has faced, posting a 41.10% loss over the last 12 months and a 9.59% decline over the course of 2026. However, the medium-term narrative offers a glimmer of optimism, showing an 11.87% recovery over the last quarter.
For the coming sessions, the immediate target for demand is to consolidate a convincing daily close above $0.103. If institutional order flow sustains this level, price will clear the path to retest the resistance zone at $0.1371. In the event of another rejection at the current pivot, the technical structure will require monitoring short-term support at $0.0865, a level where the recent congestion pattern and the final line of defense converge before compromising the crypto-asset’s structural lows.
Disclaimer: The information presented in this article does not constitute financial advice, investment recommendations, or an offer to buy or sell digital assets. Crypto-assets feature high volatility and risk of capital loss. Conduct your own research (DYOR) before trading in the market.
Communications Professional. Crypto Enthusiast. Economic Journalist. Bitcoiner & Altcoiner.