

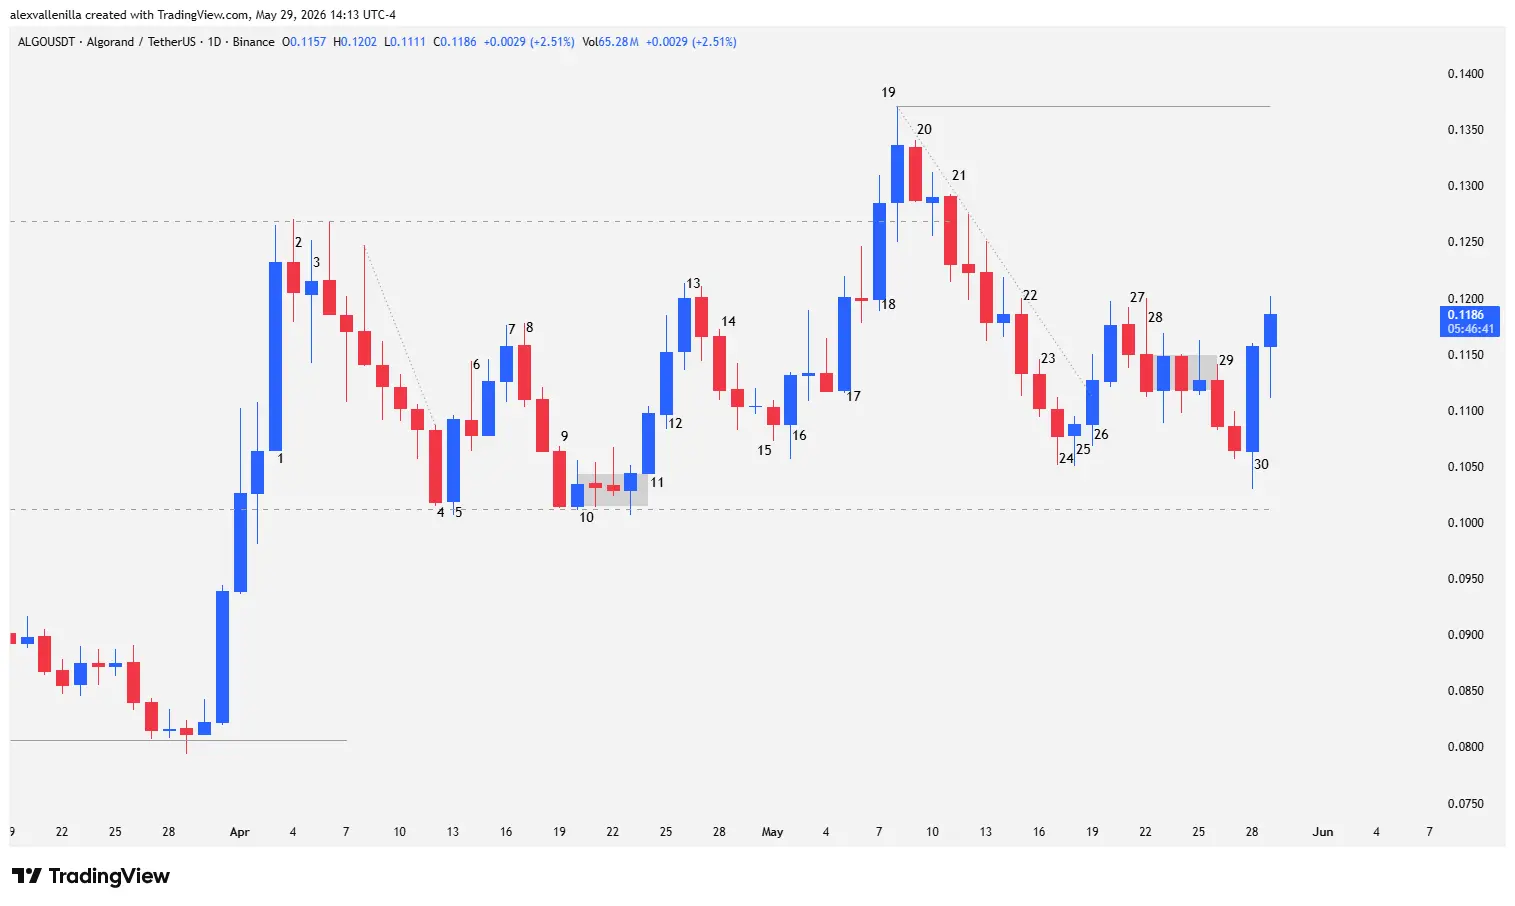
Algorand (ALGO) trades at $0.1186 at the time of this report, showing a solid recovery after an explosive 8.64% bounce driven by institutional investors in recent sessions. After breaking a prolonged 235-bar downtrend, the crypto asset is developing an accumulation structure under a “spike and channel” pattern. The price currently fluctuates between critical support at $0.1012 and technical resistance at $0.1269. Despite a previous bull trap that pulled the price back into the sideways channel, institutional order flow is defending historical lows once again, setting the stage for a medium- and long-term trend reversal if buyers can consolidate breakout volume.
Market Cycle Transition and the Battle for $0.1269
Algorand’s recent price action perfectly reflects a market transition phase. The breakout from the previous macro downtrend led to a highly defined range-bound behavior. In this environment, upward moves show a crucial characteristic: the participation of “smart money.” Bullish impulse bars are notably wider, more efficient, and faster than bearish corrections, which develop via narrow microchannels, small-bodied candles, and constant rejection tails, showing a clear lack of selling conviction.
However, the crypto market is never free of liquidity sweeps. The recent breakout of key resistance at $0.1269 (a level that held the price for 102 bars and represented the last relevant lower high of the downtrend) failed to sustain itself. This triggered a deep retracement that threatened to pierce the bottom of the range at $0.1012, reviving the threat of bears executing a sell-the-rally strategy under the influence of the previous bearish bias.
Price Action Breakdown
To understand market psychology and actual order flow, we analyze the candle sequence on the daily (1D) chart in detail:
Bars 1 to 3 (Initial Impulse and Exhaustion): Bar 1 injected an efficient 15.79% bullish impulse, confirming the breakout from previous support at $0.1012. However, it acted as a buying climax acceleration candle (the third consecutive impulse) and left a small upper tail without testing $0.1269. Bar 2 offered continuity, but Bar 3 marked the beginning of exhaustion: a small-bodied doji with wide tails that revealed high effort but zero efficiency. Subsequently, the market began a sustained decline within a very narrow bearish microchannel with small candles.
Bars 4 to 7 (Capitulation and Defensive Bounce): Bar 4 functioned as a capitulation climax candle at the end of the microchannel, keeping its low above $0.1012. This allowed bulls to print Bar 5, an excellent outside engulfing candle with no tails that broke the bearish channel. Although sellers tried to counterattack with a pin bar on Bar 6, its low remained well above the 50% level of the previous bar, showing bearish weakness that consolidated into a subsequent inside candle. Bar 7 provided continuity but showed deceleration in its body.
Bars 8 to 10 (Failed Support Breakout): Bar 8 acted as a bearish outside candle that confirmed a new retracement. Selling pressure extended into Bar 9, a candle with high conviction but a moderate body that lacked technical follow-through and respected the $0.1012 support. The subsequent Bar 10 (bullish inside candle) validated the bears’ failed breakout, entering a congestion zone.
Bars 11 to 16 (Base Building and Absorption): Buyers broke the congestion upward with Bar 11, extending the move into Bar 12. After profit-taking on Bars 13, 14, and 15 (which formed a classic bearish deceleration pattern with shrinking bodies), bulls reacted on Bar 16. This outside candle with a prominent lower tail revealed strong supply absorption at lower levels, marking a higher low relative to Bar 10 and ending the two-legged pullback phase.
Bars 17 to 22 (The Bull Trap / Low 2 Setup): Bar 17 unleashed a solid impulse with tiny tails, printing higher highs and higher lows on its way to resistance. Bar 18 expanded the move by 7.26%, closing above the key $0.1269 resistance via institutional volume. Bar 19 marked the climax: high volatility, two-sided tails, and a new high at $0.1371, a zone where short-term sellers appeared. The lack of bullish follow-through on Bar 20 (bearish inside candle) triggered alarms. Finally, Bar 21 pushed the price back below $0.1269, setting up a high-probability institutional Low 2 sell pattern at the top of the range. When the low of Bar 21 broke, stop market sell orders triggered, dragging the price down on Bar 22 and confirming the bull trap.
Bars 23 to 29 (Deceleration and Liquidity Testing): The decline extended into Bars 23 and 24 but lost momentum and body size against macro support. Bulls defended the lower zone on Bars 25 and 26, breaking the bearish microchannel. After brief volatility and indecision on Bars 27 and 28, followed by a minor bearish breakout on Bar 29, sellers exhausted their remaining floating supply.
Bar 30 and Current Bar (Institutional Absorption): The bearish attempt to break $0.1012 ended in a total failure. Smart money stepped in aggressively on Bar 30, sweeping stop-losses and absorbing lower liquidity to print a massive 8.64% outside candle with a near-shaved top. The Current Bar trades at $0.1186, maintaining the bullish momentum of Bar 30 ahead of its final close.
Algorand’s technical behavior proves the asset remains under heavy institutional accumulation at the $0.1012 floor. To confirm a definitive medium-term trend reversal, buyers must invalidate the last bull trap by convincingly clearing the Bar 19 resistance at $0.1371, opening a technical path toward $0.1456. If successful, ALGO will end its transition phase to kick off a new structured bull cycle.
Disclaimer: This analysis is purely informative, educational, and technical; it does not constitute under any circumstances investment advice, financial counsel, or an operational offer to buy or sell digital assets. Crypto assets exhibit high volatility; conduct your own research before risking capital.

Communications Professional. Crypto Enthusiast. Economic Journalist. Bitcoiner & Altcoiner.


