

The crypto market just logged a structural breakout of massive significance. Tether dominance (USDT.D), a key metric for measuring liquidity sheltered in the leading stablecoin, broke a 317-bar primary bullish channel after collapsing 6.88% in a single session. The move confirms the end of a prolonged distribution phase and directly injects fresh capital into bitcoin, Ethereum, and the rest of the risk-on assets.
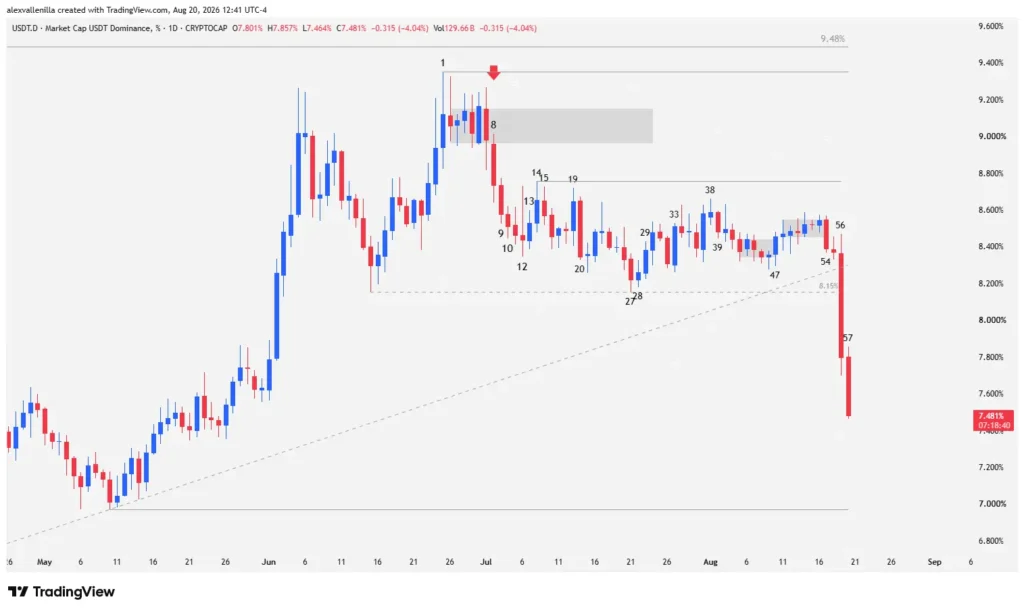
The double rejection at the 9.48% macro resistance—the indicator’s all-time high—triggered buyer exhaustion that ended in an aggressive liquidation of defensive positions. By piercing the local floor at 8.15%, digital dollar liquidity is rapidly rotating into risk assets, marking the end of a compression cycle that kept the market frozen for weeks.
Price Action Technical Analysis: From Barbed Wire to the Impulsive Breakdown
Detailed bar-by-bar analysis of the USDT.D chart reveals the clear psychological sequence where supply took control and dismantled the buyers’ defense.
The Battle at Initial Support and Loss of Momentum
Selling pressure began showing early signals on Bar 27, which tested key support at 8.15%. Although it printed a bearish body candle with a lower tail, it failed to break the level on its first attempt. Average volume suggested from the start that this floor lacked the liquidity needed to sustain a solid recovery.
Bar 28 acted as an inside bar with a bullish body, temporarily halting selling intent and setting up a reversal that Bar 29 confirmed when price surpassed the previous high. Buyers attempted to take definitive control on Bar 33, printing a high-conviction candle that trapped Bar 32 sellers after a two-bar pullback.
However, bullish momentum showed signs of structural exhaustion shortly after:
Bar 38: A tight-range doji formed that failed to follow through on the momentum from Bar 37. By logging a lower high relative to Bar 14 (resistance at 8.75%) and Bar 19, Bar 38 confirmed demand weakness and forced the market into a compression range.
Bar 39: Bears responded with an engulfing bar that overlapped the entire body of Bar 38 and closed below its low, trapping late buyers.
Distribution in “Barbed Wire”
After Bar 39, price action boxed itself into a severe congestion pattern (barbed wire) for five sessions. Characterized by tiny-bodied candles and multiple directionless wicks, this behavior at the top of a prolonged uptrend operated as a clear institutional distribution process.
Bulls attempted to break out of the congestion on Bar 47 but failed, logging a tiny-range candle with zero conviction. Bar 48 negated the move, pushing price back into the tight pattern for six additional sessions.
The Impulsive Breakdown: Bars 54 to 57
The resolution of this accumulated bearish pressure accelerated forcefully:
Bar 54: Sellers broke through the barbed wire with a conviction candle backed by average volume, validating the range exit.
Bar 55: Recorded a moderate bearish body that indicated a lack of buyer response to defend the lower boundary of the 317-bar primary bullish channel.
Bar 56: Smart money burst in with violence. This extremely high-conviction bearish candle logged a 6.88% collapse on massive volume. The body covered almost the entire daily range, leaving negligible wicks at the extremes. The bar cleanly pierced the bullish channel and destroyed the 8.15% support that had held for 65 sessions.
Bar 57 (Developing): Maintains bearish continuation dynamics by trading below the Bar 56 low. Accompanied by high volume, Bar 57 confirms the breakdown and opens a clear technical path toward the next key structural support at 6.97%.
Market Context: Bull Run Confirmation or Bear Trap?
The double failure at the 9.48% historical resistance (first recorded at the all-time high and reconfirmed with the failed attempt on Bar 1) applied Price Action’s core rule: when the market attempts to reach a target twice and fails, it tends to execute an equal-magnitude move in the opposite direction.
Falling volume from Bar 1 to Bar 54 confirmed that smart money gradually distributed positions while retail tried to keep the trend alive. The current breakdown invalidates the three-push bullish structure that sustained dominance for months.
To confirm an extended bull run across the crypto ecosystem, USDT.D must test the 6.97% target—the first support level of the previous macro trend—and consolidate below it. Failing to break that level could turn price action into a bear trap for USDT.D (and a bull trap for risk-on cryptocurrencies). However, the volume and sheer force of Bars 56 and 57 give high statistical probability to continued downside.
The collapse in Tether dominance marks a cycle shift in market psychology. Capital flowing out of liquid positions and into risk assets dismantles the previous defensive trend and kicks off a revaluation phase across the global crypto market.
Disclaimer: This article is strictly for informational and educational purposes based on price action technical analysis. No content constitutes investment advice or financial guidance. Crypto asset markets carry high volatility; conduct your own research before making operational decisions.

Communications Professional. Crypto Enthusiast. Economic Journalist. Bitcoiner & Altcoiner.


