

What does capital flow in the crypto market actually tell us when the synthetic dollar starts to falter? Tether dominance (USDT.D), which measures the percentage of the total market capitalization parked in this stablecoin, is flashing signs of extreme structural fatigue after a 284-session macro rally.
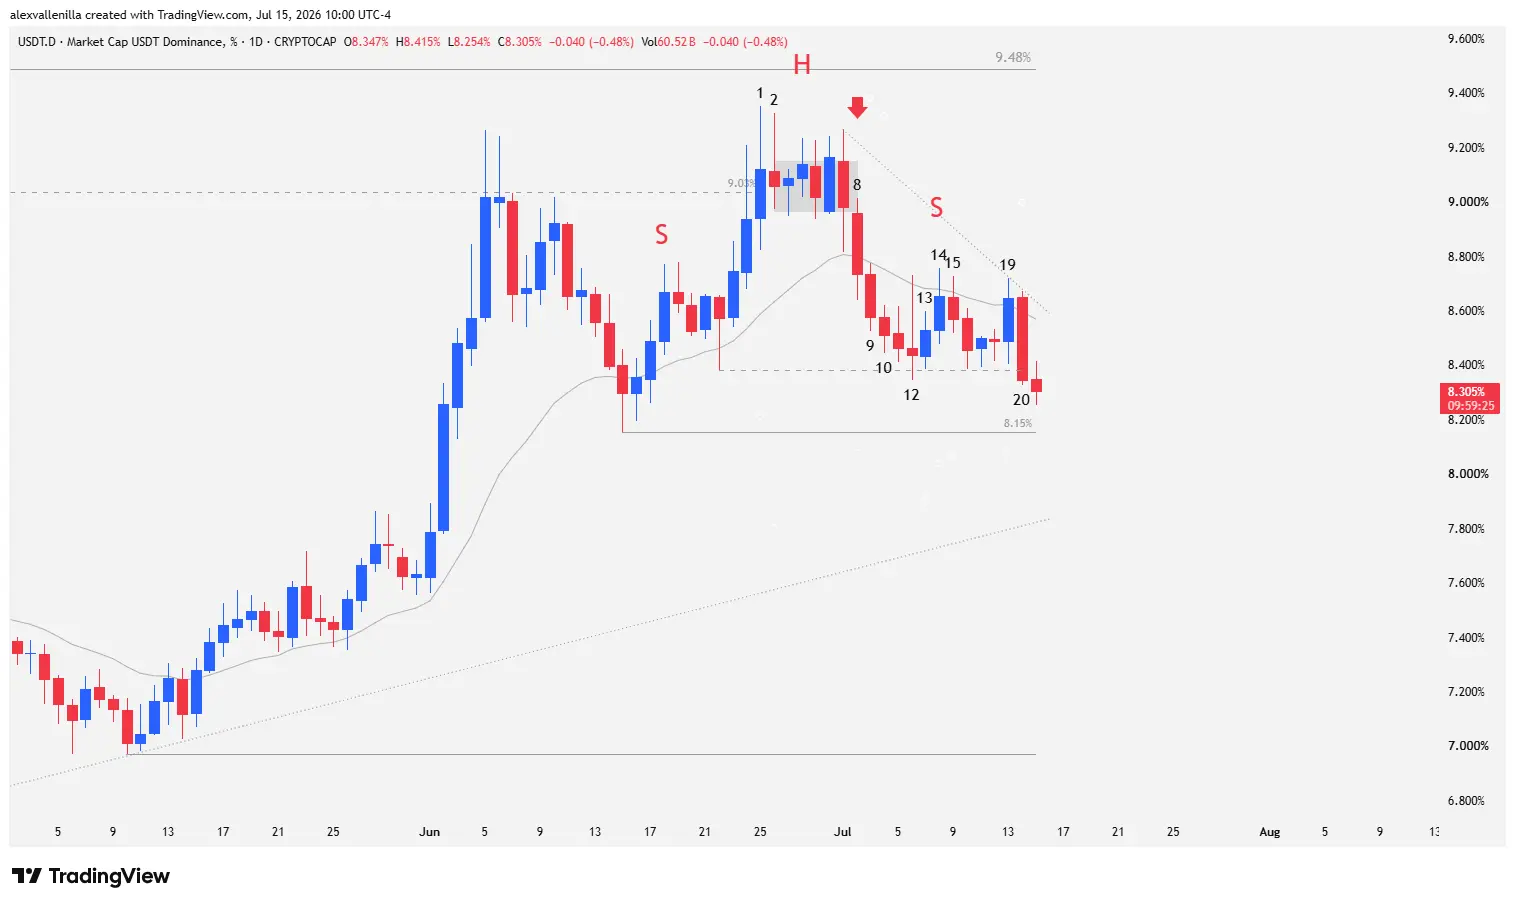
The price action over the last 20 bars reveals a classic psychological transition: buyer exhaustion followed by imminent capitulation at key support levels. If this move is confirmed, the capital frozen in digital cash is poised to rotate aggressively into risk-on assets.
To understand the current scenario, we must zoom out and analyze the larger structure. USDT dominance established a strong macro uptrend over 284 bars, printing a harmonic pattern of three upward impulses.
However, the third macro impulse was already showing a clear loss of momentum, failing to decisively break above local resistance at 9.03%. The subsequent attempt to build a second leg up to extend that third move (a technical fourth impulse) ended up being a bull trap at the top of the cycle.
Bar-by-Bar Technical Analysis: A Radiography of Exhaustion
The Market Top (Bars 1 to 7)
Bar 1: This bar completes the second leg of the final impulse and manages to pierce key resistance at 9.03% (the high of the second major impulse). However, the move fails as it cannot close above the high of the third impulse at 9.26%, and it falls far short of testing historical resistance at 9.48% (which has been inactive for 1,488 sessions). The huge upper and lower tails on this high-volatility bar denote a fierce battle where supply completely absorbed demand.
Bar 2: This prints as a bearish inside pinbar with a prominent upper shadow. By printing a lower high and failing to follow through on the Bar 1 breakout, it confirms technical exhaustion. Price enters a compression phase, forming a directionless micro-range between Bars 3 and 7.
The Transition of Control (Bars 8 to 13)
Bar 8: Bears take the initiative. They break the low of Bar 7, pierce the 20-period exponential moving average (20 EMA), and break down the micro-range. Technically, this triggers a Low 2 short setup (the second attempt at a bearish continuation). Although trading against the primary trend, the prior loss of momentum gives this setup a high probability of success.
Bar 9: This provides immediate confirmation by breaking below the low of Bar 8, triggering pending market sell orders.
Bars 10 and 11: Downward momentum temporarily slows down. The body of Bar 10 is smaller than Bar 9, which is smaller than Bar 8. This deceleration occurs as price approaches local support at 8.38%. Bar 11 actually fails to close below the low of Bar 10.
Bar 12: Tests support at 8.38% via a high-volatility outside bar. Although bulls tried to push price up, briefly crossing above the 20 EMA, supply reacted and closed the candle in its lower third, leaving a long upper tail. Despite bearish control of the candle, the lack of new closing lows (Bar 12 does not close below Bar 11) warns of a halt in the decline.
Bar 13: An inside pause bar that defends the 8.38% support, stalling immediate bearish continuation and setting up a technical bounce.
The Head-and-Shoulders Trap (Bars 14 to 20)
Bar 14: Price bounces, breaking above the high of Bar 13 and piercing the 20 EMA to the upside. This triggers a High 2 buy setup (the second attempt at a bullish reversal) that immediately fails due to a lack of follow-through. The failure of this setup instantly attracts institutional sellers. Structurally, this move carves out the right shoulder of a Head-and-Shoulders (H&S) pattern, where Bar 1 acts as the “head” and Bar 7 acts as the “left shoulder.”
Bar 15: A bearish inside bar that traps late buyers from Bar 14 and drags price back below the 20 EMA.
Bar 16: Triggers a new Low 2 sell signal. Although bears fail to break the 8.38% support initially (resulting in two bars of sideways consolidation), the bullish structure is severely damaged.
Bar 19: Bulls make a last desperate effort. They push above the 20 EMA but print a lower high compared to Bar 14 and Bar 7. Selling pressure compresses price against the 8.38% support.
Bar 20: A wide-range bar with strong bearish conviction. It completely traps the buyers from Bar 19 and achieves a solid close below key support at 8.38%. This breakout validates the neckline breach of the Head-and-Shoulders pattern.
Market Implications: Is a Crypto Rally Coming?
The loss of support at 8.38% via Bar 20 opens the door to target the next liquidity pool at 8.15%. If bears manage to pierce this zone, it would confirm the full projection of the reversal pattern.
Bearish Targets: A consolidated break below 8.15% projects a measured move equal to the distance between Bar 7 and Bar 12. This could push USDT dominance toward the major bullish trendline at 7.83%, with a final technical target at 7.31%, near structural support at 6.97%.
The Alternative Scenario: If this move fails to break below 8.15% and buyers regain ground, the level to beat for the bulls remains the formidable historical resistance at 9.48%.
In terms of correlation, a drop in USDT dominance (USDT.D) is the historical fuel for bull markets. When the percentage of capital parked in passive money decreases, it means those billions of dollars are flowing directly into bitcoin (BTC) and major altcoins. The confirmation of this chart pattern on Tether dominance could be the technical trigger for the next major digital asset rally of this year.
Disclaimer: This analysis is presented for informational and educational purposes only. It does not constitute financial advice, investment recommendations, or an offer to buy or sell digital assets. Crypto assets exhibit extremely high volatility; trade at your own risk and conduct your own analysis.

Communications Professional. Crypto Enthusiast. Economic Journalist. Bitcoiner & Altcoiner.


