The crypto ecosystem is closely monitoring XRP price action, which is currently undergoing a critical technical compression phase on the daily (1D) chart. Following a dominant 276-bar downtrend, the asset is attempting to find a firm floor. Buyers have established a line of defense at $1.27, while selling pressure continues to create lower highs, forming an equilibrium triangle that promises a volatile resolution in the short term.
Market Pulse: Between Rejection and Resistance
Despite XRP recording a 35.94% loss over the last year and a 23.03% retracement year-to-date in 2026, the past week shows a slight reprieve with 1.86% gains. This shift in momentum suggests that seller exhaustion might be making way for an accumulation phase, provided the critical low of $1.11 remains intact.
Technical Analysis: Breaking Down Price Action (1D)
The narrative of recent sessions is defined by a power struggle within specific liquidity zones. Below, we analyze the key bars shaping this structure:
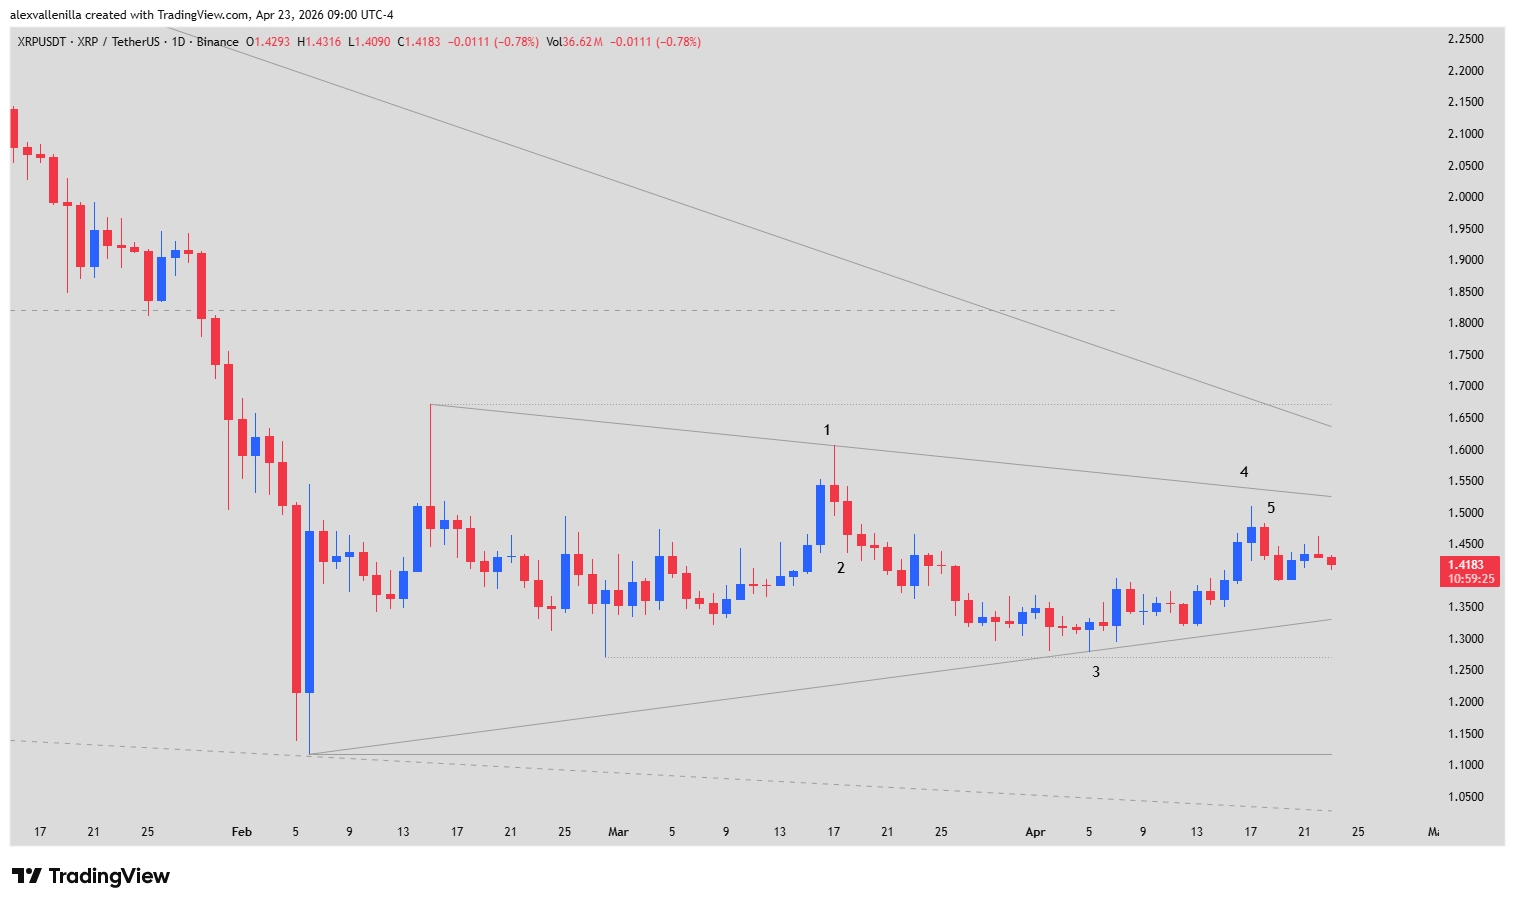
Bar 1 (Bearish Pin Bar): This session acted as a “bull trap.” Price attempted to test the $1.67 resistance but faced a violent rejection, leaving a long upper wick. This lower high served as the first anchor point for the descending trendline of the current triangle.
Bar 2 (Bearish Continuation): This confirmed the negative sentiment from Bar 1. Sellers took control, driving a “two-legged” corrective move seeking liquidity at lower levels.
Bar 3 (Bullish Pin Bar): A crucial moment for bulls. Price marked a higher low by holding above the $1.27 support. This active defense from buyers validated the bottom of the triangle, injecting moderate optimism and sparking a bounce, albeit on low volume.
Bar 4 (Bullish Doji): Indecision personified. Although it closed in the green, the high was lower than Bar 1, showing that bulls still lack the strength necessary to break the sideways structure. Bears capitalized on this weak rally to re-enter the market.
Bar 5 (Pullback and Trap): Bulls who bought into Bar 4 found themselves trapped. However, bears are also struggling, as they have failed to pierce the horizontal support at $1.27. The result is a congestion zone that is ratcheting up market tension.
Structure and Breakout Outlook
Currently, XRP sits in a state of precarious equilibrium. Although the macro trend (276 bars) remains bearish, the upward moves prior to Bar 1 showed more verticality than the subsequent corrections. This suggests that while we are in a continuation pattern—as triangles often favor the preceding trend—the $1.27 support is acting as a solid accumulation base.
The key confluence zone lies between the dynamic resistance at $1.63 and the static resistance at $1.67. A breakout above these levels would invalidate the long-term bearish narrative. Conversely, losing the $1.27 mark would likely see price quickly seek the psychological and technical support at $1.11.
The Calm Before the Storm
Price compression in XRP is a classic signal that an explosive move is underway. The market is deciding whether this triangle is the necessary pause to reverse the annual trend or simply a pitstop before seeking new lows. Traders should monitor volume at the $1.63 confluence zone to confirm a potential breakout.
Disclaimer: This analysis is for informational and educational purposes only. It does not constitute financial advice or investment recommendations. Cryptocurrencies are high-volatility assets; only invest capital you are willing to lose.
Communications Professional. Crypto Enthusiast. Economic Journalist. Bitcoiner & Altcoiner.