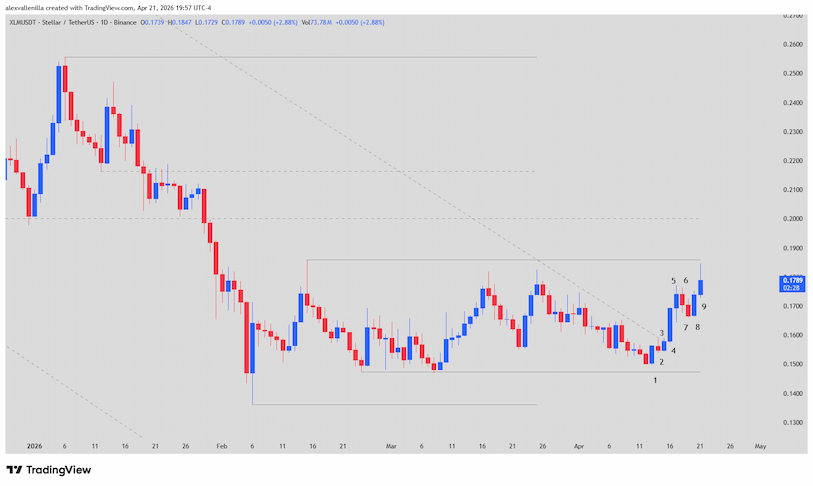
Following a prolonged technical winter, Stellar (XLM) executed a textbook move that caught analysts’ attention. In a decisive nine-session sequence, the asset not only invalidated a bearish channel spanning nearly 300 bars but also established an accumulation range suggesting a shift in market sentiment. Currently priced at $0.179 with a 2.93% daily gain, XLM is attempting to shake off its negative yearly performance (-10.95% YTD) to cement a new bullish structure.
The End of an Era: Major Trendline Breakout
Stellar’s macro context faced a steady decline from the $0.5206 high. However, recent price action indicates that supply has finally exhausted. Throughout a 65-bar sideways period, the market transitioned from a descending channel into a Spike and Range pattern, where buyers are displaying an aggressiveness absent for months.
This transition is fundamental: when an asset breaks a trendline of such magnitude (271 bars), price typically seeks the nearest range resistance first and, subsequently, previous highs.
Technical Analysis: The 9-Bar Narrative
To understand XLM’s immediate future, we break down the battle on the daily chart (1D) through its most recent candles:
Reversal and Breakout Phase (Bars 1-3)
Bar 1 functioned as a solid pullback following a bearish micro-channel, halting the decline before hitting the critical $0.1474 support. Although Bar 2 showed rejection, bears failed to push the price to the midpoint of the previous candle, revealing their weakness. Finally, Bar 3 acted as the definitive catalyst: a small bullish candle that broke the major bearish trendline and ended the downward structure.
Confirmation of Conviction (Bars 4-5)
Bar 4 is the star of this analysis. With a 7.22% surge and no significant wicks, it represented aggressive institutional entry. This candle confirmed the previous breakout and successfully defended the support zone. Bar 5 provided continuity to the move, although it failed to test the $0.1861 resistance.
Healthy Retracement and Sell Failure (Bars 6-9)
Bars 6 and 7: Generated necessary consolidation. The Higher Low (HL) on Bar 7 demonstrated that bears lack the strength to regain control.
Bar 8: Invalidated the retracement and trapped sellers betting on a deeper drop.
Bar 9 (Current): Shows an attempt to reach $0.1861. The upper wick indicates some traders are liquidating positions or taking profits upon completing a two-legged bullish cycle.
Projections: Where is Stellar Headed?
The current technical structure favors buyers. If XLM closes with conviction above $0.1861, the path clears toward $0.2001, a former support level that now acts as a technical magnet for price. To confirm a total macro trend reversal, the asset must conquer the $0.255 zone.
Conversely, if it loses the $0.1474 support, the next safety net sits at $0.1361. However, the strength of Bar 4 reduces the probability of this scenario. We are witnessing an accumulation phase where buyers absorb every correction with a long-term outlook.
Disclaimer: This analysis is for informational and educational purposes only. It does not constitute financial advice. Crypto-asset investments carry high risk due to volatility.
Communications Professional. Crypto Enthusiast. Economic Journalist. Bitcoiner & Altcoiner.