Bitcoin (BTC) executed a high-relevance technical move by breaking a downtrend that dominated the market for more than six months. Following Thursday’s close at $75,154.29 (+0.46%), the asset is currently in a “high-price acceptance” phase, driven sideways by cautious optimism after the announcement of a 10-day ceasefire between Israel and Lebanon. Although the year-to-date (YTD) performance reflects a -14.77% drop, the 4.06% weekly recovery suggests that momentum is changing hands, even if the “barb wire” price action demands prudence.
The End of the Bearish Era and the $76,000 Dilemma
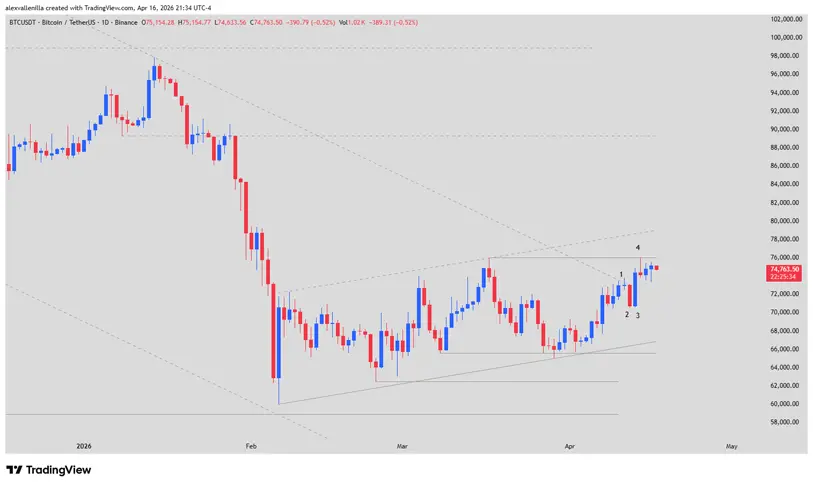
The crypto market transitioned from a prolonged descending channel to a 40-bar Trading Range. This range, bounded by support at $65,600 and resistance at $76,000, is the new battlefield. Structurally, we are moving within a 70-bar bullish micro-channel acting as a counter-trend.
The current narrative is one of transition: breaking the 189-day trendline does not guarantee an immediate bull market. Instead, it opens the door to a reaccumulation phase or a “second leg” up seeking liquidity at higher levels.
Technical Analysis: The Bar-by-Bar Battle
To understand the immediate future, we must dissect the four key sessions defining current behavior on the daily (1D) chart:
Bar 1 (Doji at Resistance): Represented the first bullish assault on the bearish trendline. Although the high pierced the line, the close below confirmed that supply still outweighed demand in that critical zone.
Bar 2 (Failed Bearish Breakout): A solid 3.15% bar that attempted to punish the indecision of Bar 1. However, by failing to break the low of the previous congestion pattern, it became a Failed Breakout for the bears, trapping short sellers and fueling the next move.
Bar 3 (Bull Surprise / Breakout): The definitive catalyst. A wide-range bar with a 5.20% expansion that officially broke the 189-bar trend. The absence of a lower wick underscores absolute buying conviction, though its inability to test $76,000 that same day left unfinished business for the bulls.
Bar 4 (Rejection Pinbar): Price finally reached the $76,000 level but was rejected, printing a bearish pinbar. Nonetheless, the lack of subsequent selling follow-through has resulted in Barb Wire—where bars overlap—indicating the market is digesting gains before the next major move.
Scenarios: Targets and Trading Signals
Price action analysis suggests two clear paths for the technical investor:
1. Bullish Scenario: The Path to $89,300
If bitcoin achieves a solid close above the high of Bar 4 ($76,000), it would validate the continuity of the bullish leg. The first target is the dynamic resistance of the micro-channel at $79,000. Once cleared, the measured move projects price toward $89,300, a former historical support zone that will now act as a liquidity magnet.
2. Range Scenario: The Double Top
A second failure to overcome $76,000 would confirm a short-term Double Top pattern. This would invalidate current momentum and force BTC to seek support at the base of the bullish channel, located near $66,900.
Overcoming the 189-day trend is a milestone, but the shift from a downtrend to an uptrend usually requires a broad sideways transition phase. Do not rule out a prolonged consolidation before seeking new highs.
Disclaimer: This analysis is for informational and educational purposes only. It does not constitute financial advice or an investment recommendation. Cryptocurrencies are high-volatility assets; only invest capital you are willing to lose.
Communications Professional. Crypto Enthusiast. Economic Journalist. Bitcoiner & Altcoiner.