In a session marked by volatility, the PENGU token achieved a crucial technical breakout after 67 days of sideways consolidation. Driven by Bitcoin’s recovery above $78,000 and a cascade of short liquidations exceeding $418 million across the global market, the price hit $0.0084. This move challenges a major bearish structure that has dominated the asset for 273 daily bars.
The Context: Accumulation After the Winter
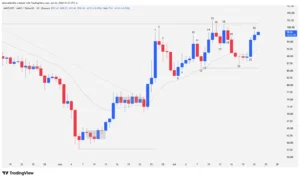
The Pudgy Penguins (PENGU) ecosystem has navigated turbulent waters. Following a 273-bar macro downtrend, price found a floor near its all-time lows, initiating a re-accumulation phase. Over the last 67 sessions, the asset remained trapped in a defined range between support at $0.0058 and psychological resistance at $0.0082.
Market dynamics shifted drastically in the last 24 hours. Bitcoin correlation and the high-beta nature of memecoins allowed PENGU to capitalize on systemic optimism. Currently, the token boasts an impressive 68.53% annual return, recovering from a complex start to 2026. While it still shows a slight 2.56% year-to-date (YTD) decline, it carries a monthly momentum of 26.36%.
Technical Analysis: From Congestion to Explosion
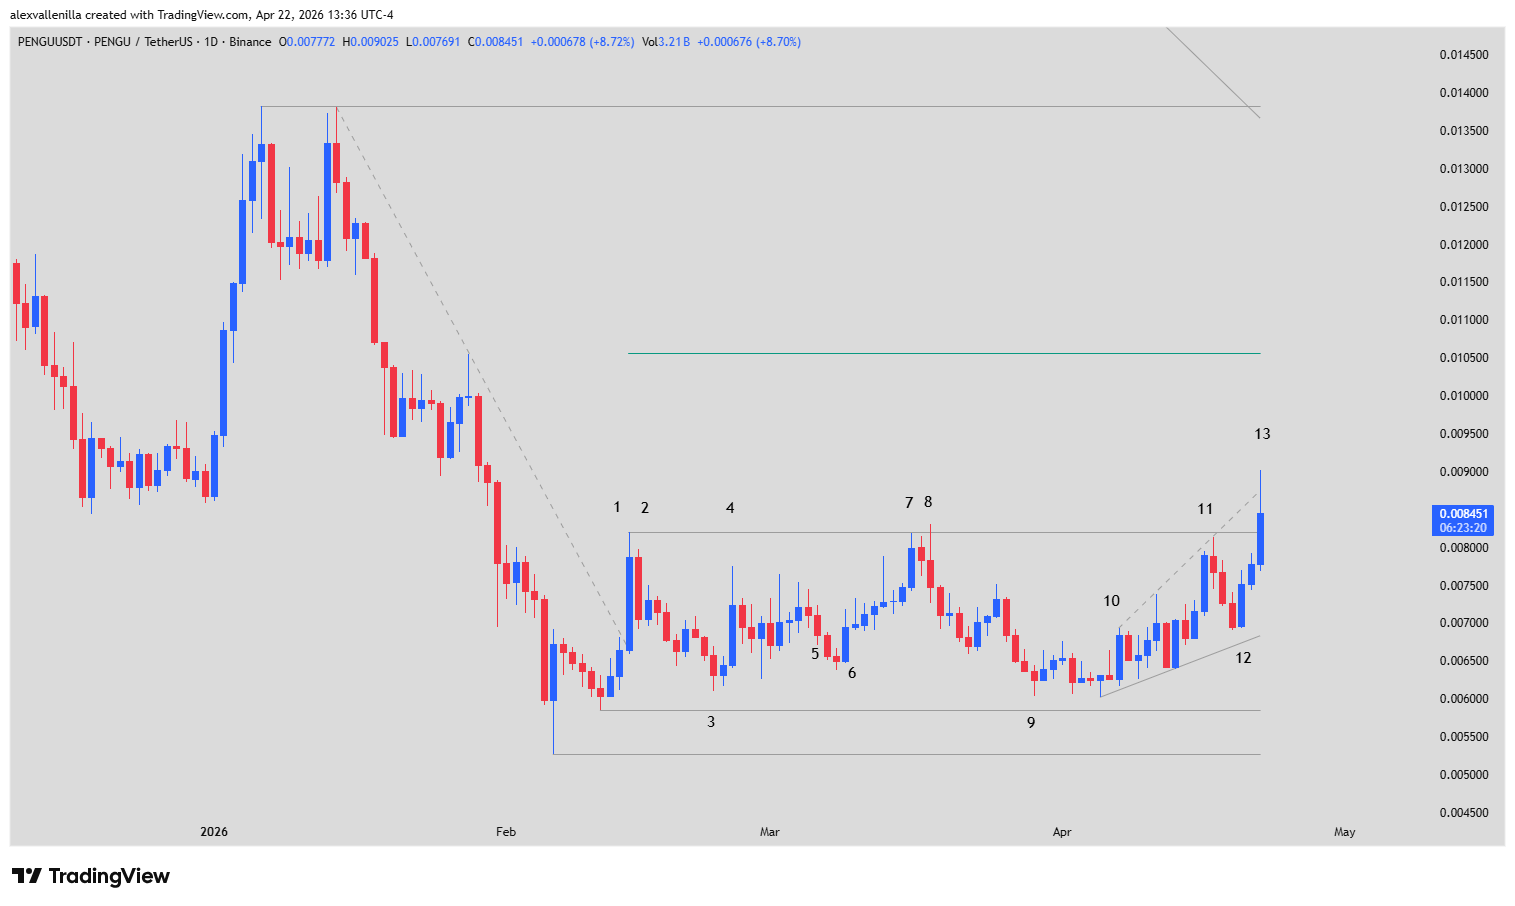
A detailed analysis of the daily chart (1D) identifies the tug-of-war between buyers and sellers:
The Initial Breakout (Bar 1): This high-conviction bullish candle broke a 31-bar micro-downtrend, establishing the range ceiling at $0.0082.
Indecision Phase (Bars 2 to 5): Following an inside bar consolidation (Bar 2), price underwent a two-legged pullback. Bar 3 showed strength by marking a higher low above $0.0058 support. Bar 4 represented the first failed attempt by bulls, leaving a 30% upper wick that resulted in a “barbed wire” pattern or tight congestion (Bar 5).
Support Defense (Bars 6 to 10): Bulls progressively defended higher levels (Bar 6). Although Bar 7 was climactic and tested resistance, Bar 8 acted as a bull trap, sending price back to the range base. However, the bears’ inability to test support at Bar 9 and the lack of bearish follow-through at Bar 10 confirmed that selling pressure was exhausting.
Wedge Construction (Bar 11): A strong conviction candle that, while rejected, helped define an expanding wedge pattern. This pattern, characterized by its three previous pushes, often precedes high-volatility moves.
Current Momentum (Bars 12 and 13): After a low-intensity pullback, Bar 12 set a new high within a 17-bar short-term trend. Finally, Bar 13 (ongoing) represents the definitive breakout, trading at $0.0084 and closing above critical resistance.
Outlook: Where is PENGU Headed?
If the daily close consolidates above $0.0082, technical analysis suggests a measured move targeting the $0.0105 zone. However, the true structural challenge lies at $0.0138, a level that coincides with the dynamic resistance of the 273-bar downtrend. Clearing that hurdle would signal an official trend reversal from bearish to bullish on the macro timeframe.
PENGU has demonstrated remarkable resilience. The combination of a technical accumulation phase and an external catalyst (short liquidations) has positioned the token for takeoff. Investors should monitor whether volume supports this breakout to avoid a potential trap at current levels.
Disclaimer: This analysis is for informational and educational purposes only. It does not constitute financial advice. Investing in crypto assets carries a high risk of capital loss.
Communications Professional. Crypto Enthusiast. Economic Journalist. Bitcoiner & Altcoiner.