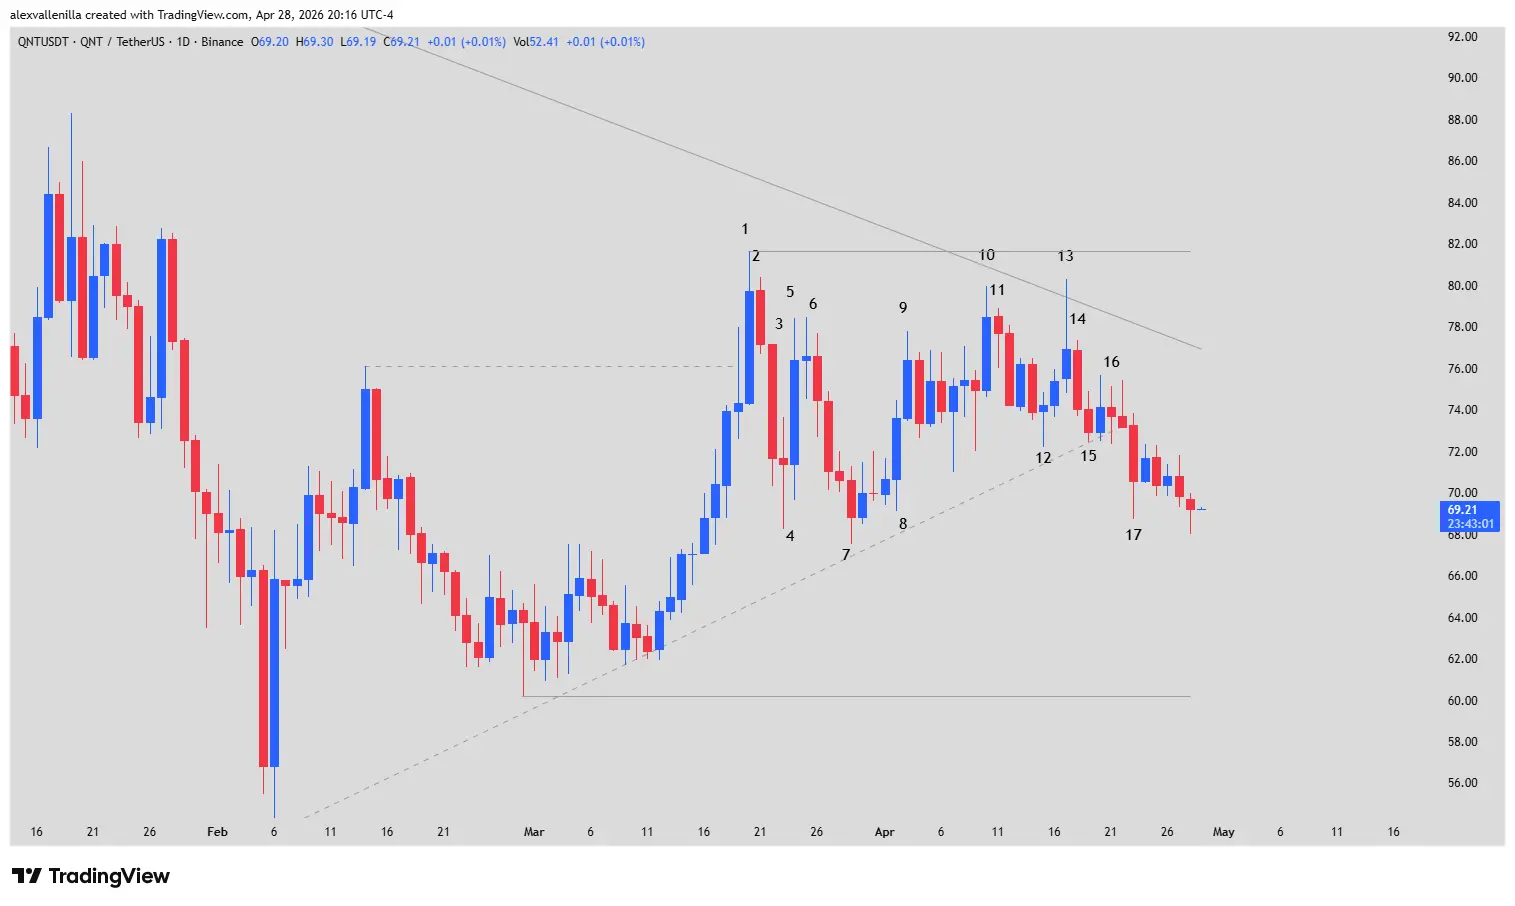
The Quant Network (QNT) market once again confirmed that the trend is boss. After an ambitious attempt by bulls to reverse a negative structure spanning 280 sessions, price capitulated after failing to pierce the key $81.66 resistance. This move, which began as a 75-bar recovery microchannel, ended up becoming a bull trap, returning QNT to a corrective path that has already seen an 8.77% decline over the last 12 months.
The Microchannel Mirage
During the latest operating cycle, QNT enthusiasts watched optimistically as a nine-bar microchannel defied the gravity of the overarching trend. This textbook move seemed to possess the strength necessary to shift the narrative. However, price action at critical levels proved that momentum was insufficient. The inability to test the primary bearish trendline—which has dominated the asset since the $135.00 level—left bitcoin’s peer vulnerable to massive profit-taking by bears operating at the upper channel levels.
Technical Analysis: Anatomy of a Forecasted Capitulation
In institutional trading, double failures are often precursors to violent moves in the opposite direction. Below, we break down the technical narrative through the daily (1D) chart’s key bars:
Bars 1 and 2: Bar 1 was a bullish climax that broke the $76.13 resistance, but its upper wick revealed exhaustion as it established a new ceiling at $81.66. Bar 2 (an inside bar) confirmed that bullish fuel had run dry after completing a two-legged move.
Bars 3 to 5: Bar 3 executed a sharp 7.12% correction. Although Bar 5 attempted a pullback by clearing previous highs, the volatility and long wicks indicated that bears were already positioned.
Bars 6 to 10: Following a period of congestion, Bar 10 represented the last major bullish effort. It approached the 280-bar trendline, but by failing to touch it (a failed test), it invited sellers to aggressively liquidate positions.
Bars 11 to 13 (The Double Failure): Bar 13 is the inflection point. It was a bullish pin bar with a massive upper wick that managed to clear the bearish trendline but failed for the second time to break the $81.66 resistance. According to auction theory, two failures at the same target trigger a total reversal.
Bars 14 to 16 (Sell Setup): Bar 14 acted as a confirmed throwback. Bar 15 set up a Low 2 pattern (a high-probability sell signal), which was finally triggered by Bar 16—a bearish doji that pierced the 75-bar counter-trend channel.
Bar 17 (Trend Confirmation): This bar decisively broke the dynamic support of the mini-channel, returning QNT to its dominant bearish structure and invalidating any short-term recovery attempts.
Projections: Where is QNT Headed?
With the breach of the 75-bar support and the rejection at the long-term trendline, the technical outlook points toward bearish continuity. If selling pressure persists, the next technical objective sits in the $60.19 zone. So far in 2026, the asset has recorded a 0.40% retreat, maintaining a tight correlation with the broader weakness in the enterprise interoperability solutions sector.
Disclaimer: This analysis is for informational and educational purposes only. It does not constitute financial advice. Investing in crypto assets carries a high risk of capital loss.
Communications Professional. Crypto Enthusiast. Economic Journalist. Bitcoiner & Altcoiner.