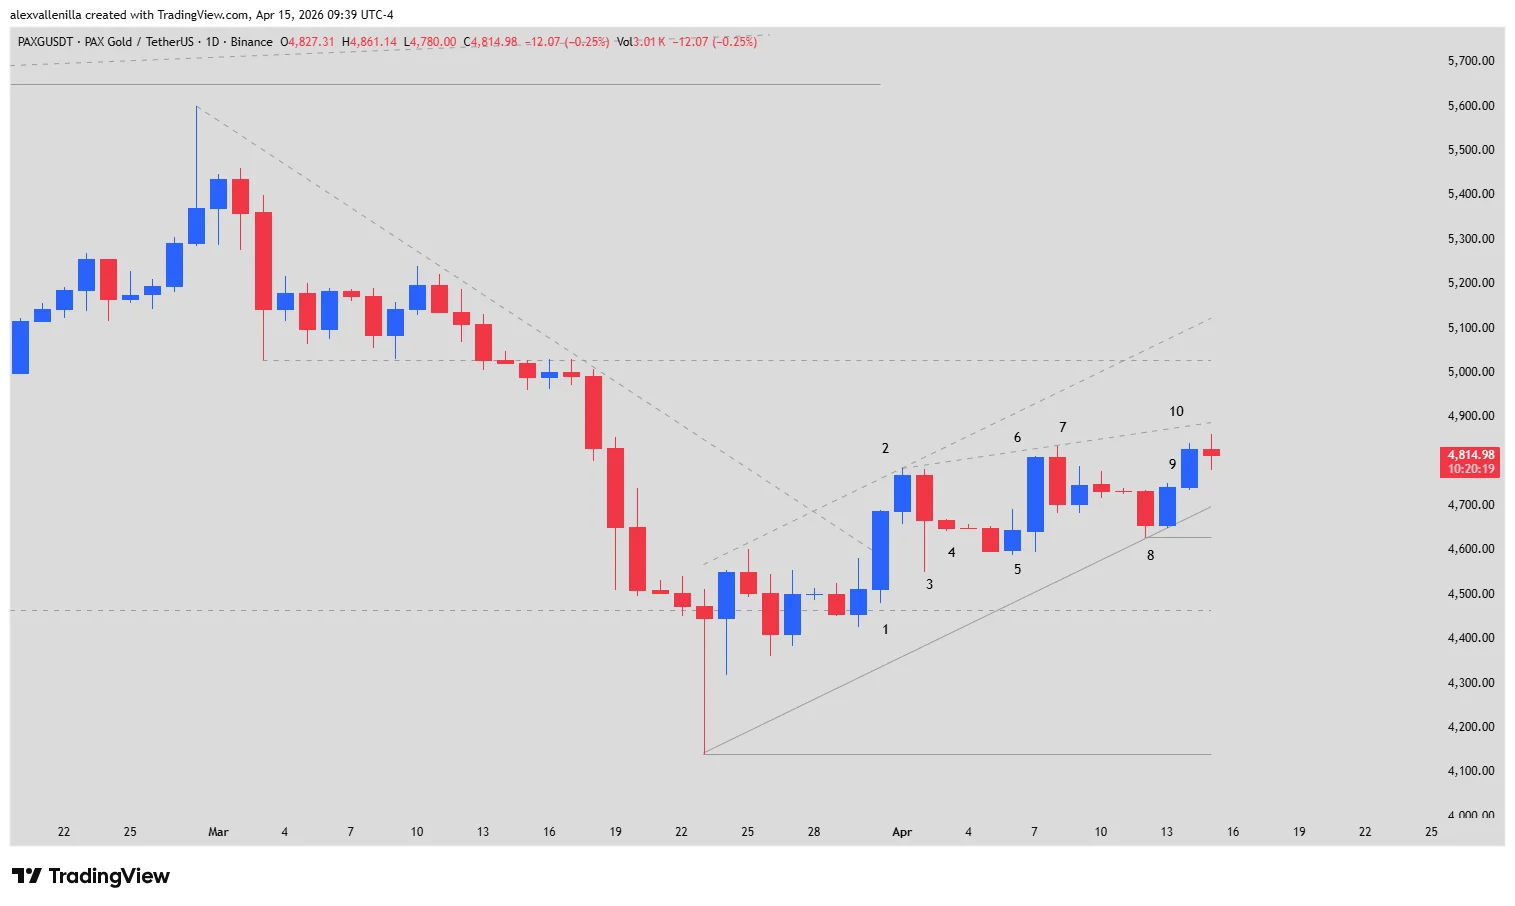
In a display of technical resilience, PAX Gold (PAXG) successfully reversed a correction that threatened to derail its long-term structure. Following a violent bounce at $4,140, the physical gold-backed crypto asset reclaimed key psychological levels, establishing a 23-bar bullish channel. However, the current formation of a rising wedge and proximity to historical resistance at $5,027 place the market at a crossroads where geopolitics and Price Action converge.
The Bulls Return: From Bear Trap to Tight Channel
The recent PAXG narrative is a lesson in market psychology. What appeared to be a terminal crash following the breakout of a 31-bar downtrend turned out to be a bear trap in the $4,140 zone. Since that point, price not only reclaimed critical support at $4,460 but initiated a “staircase” structure, where institutional buyers aggressively bought every pullback.
This move occurs against a backdrop of international de-escalation. Markets are cautiously watching upcoming negotiations between the U.S. and Iran regarding the crisis in the Strait of Hormuz. The possibility of a deal is reducing the risk premium, which paradoxically forces PAXG to prove whether its current ascent has technical fundamentals beyond geopolitical fear.
Technical Analysis: Wedge Radiography (Bar by Bar)
Price behavior since the recovery shows a transition from explosive momentum to a technical compression phase. Below is the detailed Price Action analysis:
Bars 1 and 2 (The Impulse): Bar 1 is a textbook Bull Surprise Bar; no upper wick and breaking through previous “barbed wire.” Bar 2 confirmed the breakout, setting the ceiling for the new channel.
Bars 3, 4, and 5 (Support Defense): Despite selling attempts, Bar 3 left a prominent lower wick, validating that “smart money” is buying the dips. Bar 5 established a Higher Low, confirming the correction was lateral rather than vertical.
Bars 6 and 7 (Resistance): Bar 6 showed conviction, but Bar 7 acted as a bearish Signal Bar. The close in the lower half of the previous bar’s body raised profit-taking alarms.
Bar 8 (Dynamic Support): A surgical test of the trendline. Bears failed to close below $4,629, keeping the bullish structure alive.
Bars 9 and 10 (Compression and Momentum Loss): Price began to compress. Bar 10’s inability to reach the top of the wedge suggests a loss of relative strength. At the time of this report, PAXG trades at $4,815 (-0.21%), operating at the apex of this formation.
Projections and Scenarios
Bullish Breakout (Base Case): If PAXG manages a solid close above $4,900, the technical target is a Measured Move toward $5,300, seeking to test the major resistance at $5,027. The dominance of impulse bars over pullback bars favors this outcome.
Wedge Failure: A loss of dynamic support at $4,697 and the Bar 8 low ($4,629) would invalidate the immediate bullish bias, forcing a re-test of $4,460.
A Market Waiting for Signals
PAXG is currently in a “buy the dip” phase. The long-term bullish structure (763 bars) remains intact, and the current slowdown appears to be an accumulation zone before facing all-time highs. The key will lie in whether digital gold can transform its current exhaustion wedge into a launchpad.
Disclaimer: This analysis is for informational purposes only and does not constitute financial advice. Investing in digital assets carries significant risks.
Communications Professional. Crypto Enthusiast. Economic Journalist. Bitcoiner & Altcoiner.