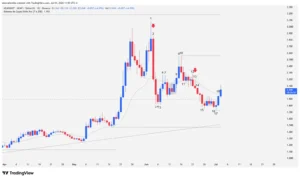
The digital finance market is witnessing a show of force from buyers on the NEAR Protocol daily chart. After a period of adjustment and strategic consolidation, the influx of institutional capital (strong hands) shifted the price structure, pushing the crypto asset above critical technical barriers. This move not only invalidates short-term bearish scenarios but also positions NEAR in a potential liftoff zone toward macroeconomic resistances that define its long-term trend.
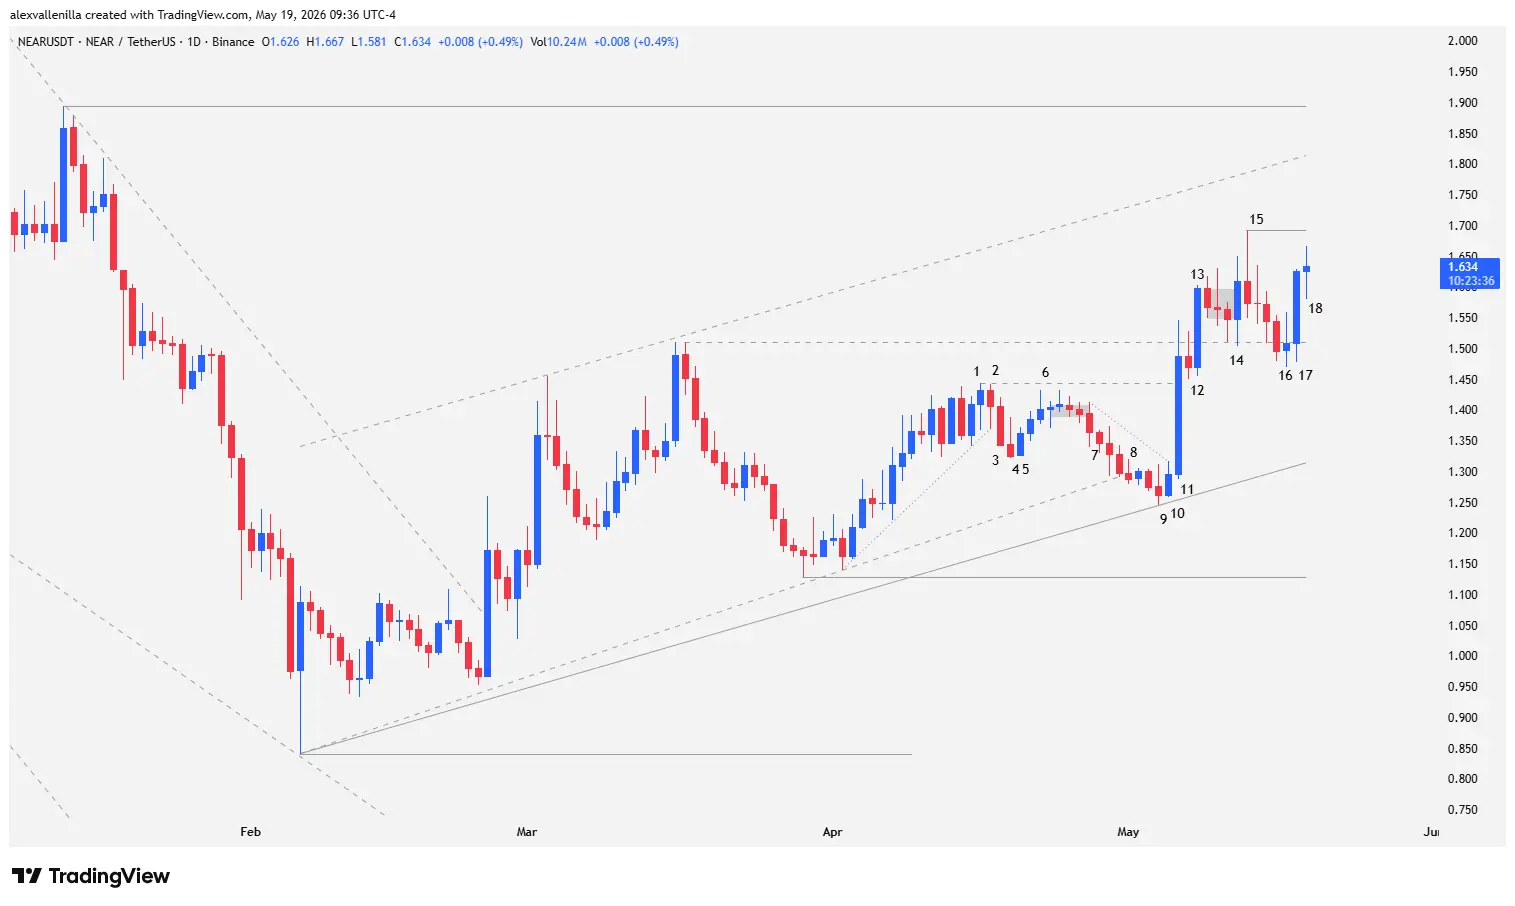
The $1.51 Battlefield: Support and Liquidity
NEAR Protocol’s price action established a true battlefield around the $1.51 level. This zone, which initially acted as an insurmountable local resistance, transformed into a crucial dynamic support after a series of tests and liquidity sweeps.
Market dynamics shifted drastically when buyers absorbed the available supply, turning the former ceiling into an operational floor. Institutional defense at this level prevented a deep correction and trapped late traders looking for short positions. The resilience of $1.51 proves that smart money views this price as an accumulative value zone, serving as a launchpad for subsequent impulses.
Detailed Technical Analysis (1D Chart)
NEAR’s current structure is understood through the chronological evolution of its candlesticks on the daily timeframe, where each session narrates the capitulation of supply and the positioning of demand.
Initial Bullish Exhaustion (Bars 1 to 4)
Bar 1: A bullish closing pin bar opened the sequence. However, its high failed to test the local previous resistance at $1.51, printing a lower high. This candle represented the end of the second push within an 83-bar bullish structure, which stemmed from the breakout of a previous 109-bar bearish cycle.
Bar 2: A bearish pin bar whose high matched that of the previous session. The formation of this reversal pattern (tweezer top) confirmed the immediate inability of buyers to challenge the resistance.
Bar 3: A solid bearish candle with a shaved bottom completed the retracement started in the previous session. This move broke below the micro bullish channel, forcing a corrective phase due to demand exhaustion.
Bar 4: Another bearish pin bar, this time with a distinct upper tail. Although it printed a lower low, the wick evidenced a failed bullish recovery attempt, forcing bears to inject more volume to maintain control.
Consolidation and Liquidity Capture (Bars 5 to 8)
Bar 5: An inside bullish candle with a shaved bottom neutralized the sellers from the previous session. This pause consolidated the price and led to bullish continuity in the following session, albeit through a weak structure.
Bar 6: A pin bar at the highs with an upper wick that exceeded its body size. Failing to test the high of Bar 1, the market entered congestion for the next four sessions.
Bar 7: A bearish candle broke the congestion with high volatility on both tails. Within the context of the micro bearish channel from Bar 6, it functioned as a high-probability Low 2 short setup. However, being near the base of the main 83-bar bullish channel, it carried high risk for trading against the trend near dynamic support. The short order triggered in the next session when its low was breached.
Bar 8: A narrow-range bearish pin bar but with an extended upper wick. It managed to close below the lower boundary of the 83-bar bullish channel, extending the corrective phase.
The Institutional Pivot and the Big Impulse (Bars 9 to 13)
Bar 9: A bearish pin bar whose low served to restructure the trendlines. This inflection point ended the deep correction and gave rise to a new 102-bar bullish directrix. The narrow ranges of the previous candles already suggested a loss of bearish momentum.
Bar 10: Buyers entered aggressively, establishing a higher low relative to Bar 9, validating the new geometric trendline.
Bar 11: A strong bullish candle that logged a 14.74% expansion. This move swept the retracement highs and simultaneously pierced the $1.44 level (Bar 1 high) and $1.51. Buying pressure triggered the bears’ stop losses, accelerating the price. Although the upper wick indicated profit-taking at resistance, it marked the third wide-range candle in the 102-bar macro trend, confirming control by strong hands.
Bar 12: A bearish inside candle reflected a necessary pause and continued short-term profit-taking.
Bar 13: A new session of strong bullish momentum expanded the price by 8.71%. More than 50% of the candle body closed above $1.51, confirming the structural breakout of the 109-bar trend. From here, the price began a congestion phase, transforming the old resistance into support.
Stabilization and Current Projection (Bars 14 to 18)
Bar 14: A wide-range outside bar with pronounced wicks on both ends. Its close managed to break through the immediate congestion and held above the new $1.51 floor.
Bar 15: A massive bearish pin bar with an upper wick that doubled its body size, establishing a local resistance at $1.62. Despite the selling pressure that caused a subsequent four-candle correction (transiently piercing $1.51), the structure printed a new higher high.
Bar 16: An outside candle with a bullish close in a Doji setup settled on the $1.51 support. The lack of bearish continuity trapped sellers who had entered during the previous session’s fake breakout.
Bar 17: A show of buying strength yielding 7.82% with almost no upper wick. The body of the candle sat firmly above $1.51, confirming institutional presence buying at higher prices.
Bar 18 (Active Session): At the time of this report, NEAR trades at $1.633 with a marginal gain of 0.49%. Although it prints a Doji, the session low respects the key support. If it clears the high of Bar 15 ($1.62), the price will target the upper bound of the 102-bar bullish channel at $1.813, a dynamic level that confluences with the structural resistance at $1.894.
Macro Projection: The $3.18 Magnet
The success of the current bullish structure relies on definitively overcoming the $1.894 barrier, a level that represents the last relevant high of the previous bearish cycle. If strong hands manage to consolidate the price above this threshold, NEAR Protocol’s technical outlook will shift toward a free expansion environment.
Under this scenario, the historical high of the previous trend located at $3.185 will act as a magnetic liquidity pool, potentially accelerating returns parabolically over the medium term.
NEAR Protocol completed a textbook technical reconfiguration, where supply absorption and short-squeezing validate control by institutional buyers. With the $1.51 support fully defended, the token faces an imminent opportunity to confirm a macro trend change if it conquers the $1.89 resistance.
Disclaimer: This analysis is for informational and educational purposes only and under no circumstances constitutes financial advice, an invitation, or an investment recommendation. Cryptocurrencies are highly volatile assets; risk only the capital you are willing to lose.
Communications Professional. Crypto Enthusiast. Economic Journalist. Bitcoiner & Altcoiner.