The cryptocurrency market is experiencing a strategic shift of high technical significance. Tether Dominance (USDT.D), which measures the share of total capital parked in the leading stablecoin as a liquidity refuge, has just validated a massive structural double top on the daily (1D) timeframe. Following a violent, climactic push that threatened to dry up liquidity for risk assets, institutional order flow executed a sharp rejection at the 9.48% historic resistance. Price action is currently breaking below key support levels, confirming a massive return of capital back into bitcoin and the crypto ecosystem.
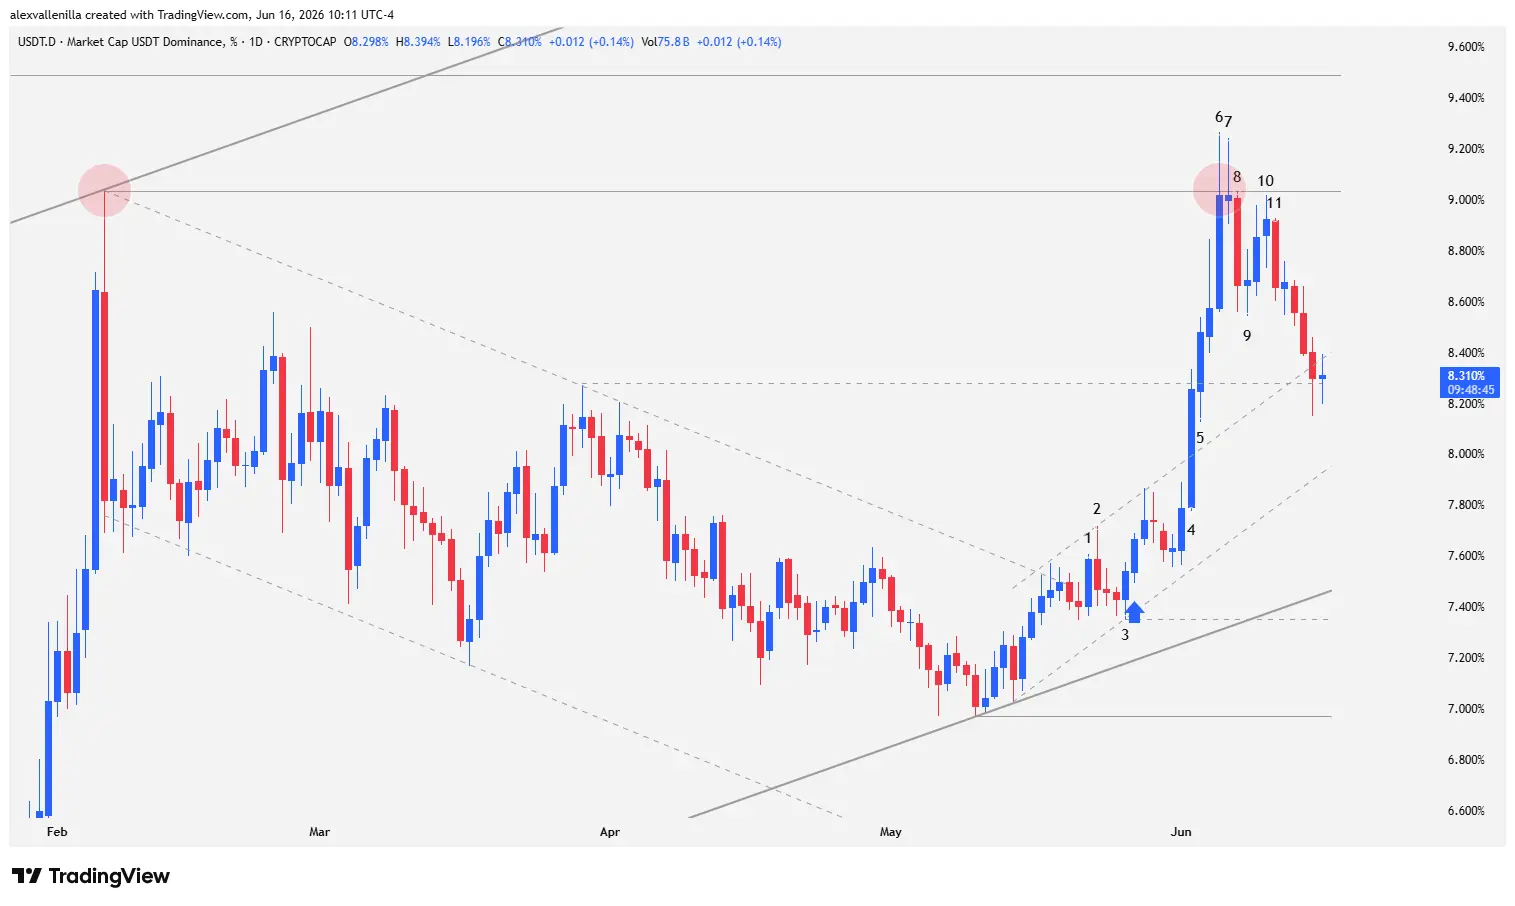
Chart Anatomy: The Rise and Fall of the Digital Safe Haven
The behavior of USDT.D on its daily chart reveals with mathematical precision how smart money on Wall Street and crypto whales move. Price action allows us to break down the microstructure bar by bar to understand current market psychology.
The Climactic Push (Bars 1 to 5)
Bar 1: Smart money confirms a breakout above the 103-bar countertrend downtrend line. This move neutralizes the previous correction attempt and resumes the 253-bar primary uptrend channel.
Bar 2: Bulls entering on the previous bar’s breakout face immediate resistance. However, bears only manage a controlled pullback. The low of this bar respects the low of Bar 1, showing a clear lack of selling pressure.
Bar 3: Price tests and validates the start of a lower trendline for a 34-bar micro uptrend channel (secondary trend). This pivot point establishes dynamic support for a new push. The subsequent bar sets up a high-probability High 2 buy setup, formally triggered on the following bar, whose high is used to plot the upper boundary of the micro-channel.
Bar 4: A robust, wide-range bullish bar with high conviction exposes aggressive institutional buying into USDT.D. This bar validates the previous higher low, breaks above the top of the 34-bar micro-channel to accelerate the move, and pierces local micro-resistance from the 103-bar countertrend channel. Price action consolidates it as a powerful buy signal.
Bar 5: This prints as a textbook breakout bar. It cleanly breaks through local swing high resistance at 8.27%. The violence of the breakout attracts institutional buyers, triggering a FOMO (Fear of Missing Out) liquidity rush seeking a massive safe haven in the stablecoin.
The Climax at the All-Time High and the Order Flow Flip
Institutional Rejection (Bars 6 to 11)
Bar 6: This marks the peak of the parabolic move, acting as a Spike bar. Price manages to pierce previous structural resistance from the primary uptrend channel at 9.03%, but buyers fail to close above this level. This results in a failed breakout and a macro structural double top relative to the historical high in that zone. Furthermore, the high of Bar 6 falls just short of testing the mythical 1461-bar resistance located at 9.48% (untested since its formation). The long upper wick or tail reveals that smart money executed limit sell orders, aggressively defending the highs.
Bar 7: Bulls attempt to print a new high but fail noticeably. The high of Bar 7 is a Lower High compared to Bar 6 and leaves another upper wick in the supply zone, closing below 9.03%. This pattern completes the buying climax from Bar 6 and triggers unmistakable signs of buyer exhaustion (Buying Climax).
Bar 8: A wide-range, extreme conviction bearish bar. It completely engulfs the body of Bar 7 and overlaps its entire range with the body of Bar 6. This high-velocity reversal confirms that institutional money has abandoned the USDT safe haven.
Bar 9: Price prints a temporary pause via a Doji bar. Selling pressure takes a momentary breather after the Bar 8 crash.
Bar 10: A two-bar technical pullback follows the previous pause. Bar 10 attempts a Bull Test to check for any remaining demand at the highs, but price prints a lower high without even touching 9.03%.
Bar 11: Bar 11 reverses hard to the downside, definitively trapping late buyers from Bar 10. It engulfs the previous body and confirms a minor double top pattern, handing absolute control to sellers in the short term.
Structural Outlook: Oxygen for the Crypto Market
Following Bar 11, price chains four consecutive bearish bars. Right now, price action is breaking below the floor of the 34-bar micro uptrend channel from the upper side, which had flipped from dynamic resistance to dynamic support and has now completely given way.
With the bullish momentum of this micro-channel lost, the current downward move looks to clear out the excesses of the previous buying climax. Under a strict order flow reading, the key levels to watch are:
Magnetic Support at 8.30%: Former local resistance from the 103-bar channel. By the principle of technical polarity, this zone should now act as the first major structural support.
Critical Support at 7.46%: The lower trendline of the 253-bar primary uptrend channel. This level represents the last line of defense to maintain the medium-term bullish macro structure in stablecoin dominance.
Because this is the USDT dominance index, every red bar on this chart equals a liquidity injection into real assets. The current bar-by-bar pullback strongly suggests that institutional capital is leaving the digital dollar parking lot to re-enter bitcoin and major altcoins en masse, relieving the systemic downward pressure of recent weeks.
Disclaimer: This analysis is provided for informational and educational purposes only, based on Price Action methodology. It does not constitute, nor should it be interpreted as, investment advice, financial advice, or an invitation to trade digital assets. Cryptocurrency markets carry a high risk of volatility.
Communications Professional. Crypto Enthusiast. Economic Journalist. Bitcoiner & Altcoiner.