Stellar (XLM) shakes up the digital finance landscape after consolidating a violent transition from a prolonged accumulation phase into a powerful bullish expansion. After breaking a 271-day descending trendline on the XLMUSDT pair, the crypto asset executes an orderly technical pullback to trigger a second expansionary leg. The move liquidates short positions and establishes a solid structural base above key support levels, transforming market skepticism into renewed technical optimism for the blockchain ecosystem.
The Institutional Takeoff: Breaking the Bearish Bias
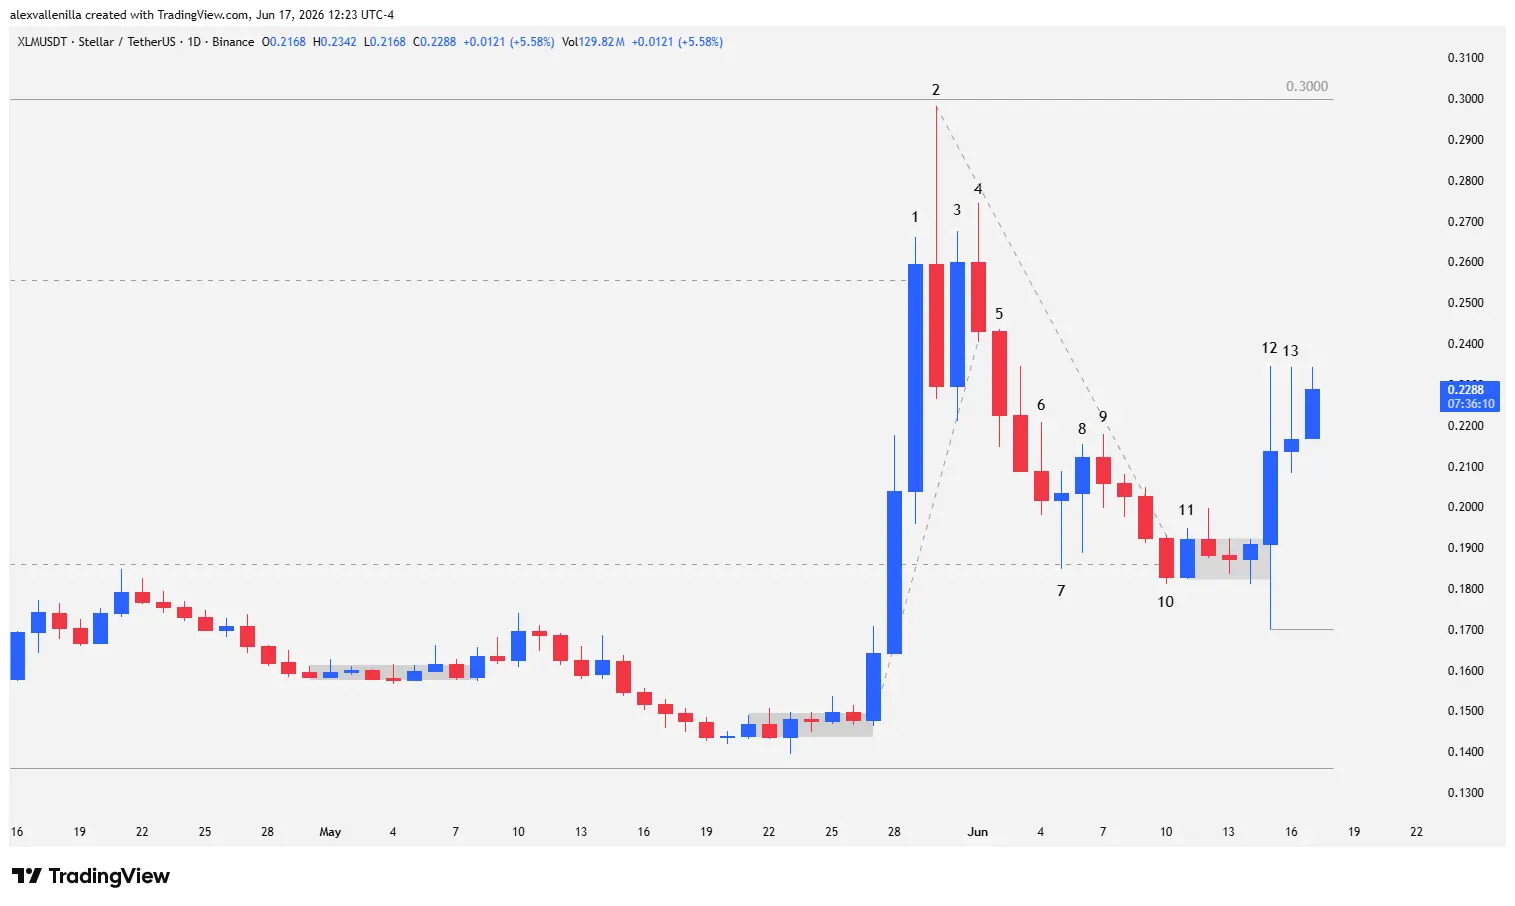
Stellar’s daily chart reflects a macroeconomic paradigm shift for the token. Throughout April and May, price patiently ranged within a primary accumulation zone below $0.1861, building the liquidity necessary for the expansionary move.
The spark that ignited the rally was the breakout of the descending diagonal trendline that kept price under pressure for 271 sessions. This institutional breakout acted as the technical catalyst that shifted market bias from bearish to heavily bullish, attracting high-conviction buy order flow.
By clearing the final lower high of the previous downtrend at $0.2557, the market formally validated a Market Structure Shift (MSS), confirming that buyers control the order flow.
Anatomy of the Price Action: Bar-by-Bar Breakdown
To understand crowd psychology and track institutional money, we break down the technical narrative of the most recent cycle bar by bar:
Initial Expansion Phase and Climax
Bar 1 (Bullish Breakout Marubozu): An extremely wide-range candle that breaches the $0.2557 resistance. It denotes massive institutional buying pressure and accelerated momentum. However, as an expansionary climax bar, it warns of potential pullbacks once buyers show exhaustion.
Bar 2 (Impulse High – Buying Climax): Price extends vertically toward the psychological resistance at $0.3000. It leaves a prominent upper wick indicating profit-taking. Failing to close above Bar 1, it confirms exhaustion. The bullish effort to conquer $0.3000 dissolves amid volatility, turning into a trap for premature buyers as price fails to consolidate above $0.2557. Bears defend the level utilizing a “sell the rally” strategy.
Corrective Phase: Zigzag Pullback
Bar 3 (Inside Bar / Pause): A candle trapped within the range of Bar 2. Its lower high confirms buyers are losing steam, though the absence of an immediate drop marks a temporary failure of the pullback.
Bar 4 (Bearish Reversal): Closes near its lows and formally begins the technical corrective phase, validating the failure of the reversal suggested in the previous session.
Bar 5 (Bearish Continuation): A wide-range, high-conviction red candle that breaks the previous five-bar bullish microchannel. Strong-handed sellers take short-term control.
Bar 6 (Temporary Slowdown): Displays a smaller body than Bar 5, printing a deceleration pattern. Its low holds comfortably above the $0.1861 support, showing a loss of bearish momentum.
Bar 7 (First Wave Low): Briefly pierces the $0.1861 support intraday but closes above it, leaving a notable lower wick that demonstrates supply absorption in the discount zone.
Bar 8 (Technical Bounce): A bullish reaction that attempts to test the short-term descending trendline following the deceleration of supply.
Bar 9 (Bullish Failure): Small body and an upper wick. Price faces rejection near the secondary descending microchannel. It classifies as a failure of the reversal initiated in Bar 7.
Capitulation and Compression Block
Bar 10 (Higher Low / Liquidity Sweep): An aggressive bearish candle acting as a Bear Trap. It sweeps the stop-losses of late buyers before recovering and closing above key support at $0.1861.
Bar 11 (Compression / Reaccumulation): A minimum-range candle that ends the 11-bar bearish microchannel. By holding price above $0.1861, it drives the asset into a tight micro-range congestion phase, crushing volatility ahead of an imminent expansion.
Current Expansion Phase: The Second Leg
Bar 12 (Bullish Ignition): A high-volatility, wide-range outside bar. It breaks the previous compression structure, clears the highs of bars 8 and 9, and establishes a definitive new floor after sweeping lower liquidity from Bar 1 and Bar 7 down to the $0.1700 area. This marks the official start of the second bullish leg.
Bar 13 (Inside Bar Consolidation): Brings stability to price, reduces the previous day’s volatility, and validates absolute demand control at current levels.
Market Outlook and Projections
Stellar’s technical structure is textbook: Expansion, Healthy Pullback (testing previous resistance turned support), and Continuation.
Having successfully defended the $0.1861 – $0.1900 zone, the immediate bias for XLM remains firmly bullish. The natural short-to-medium-term technical target for this second leg points to a retest of the macro resistance at $0.2557. If current institutional order flow persists, the crypto asset will highly likely target the key psychological level at $0.3000.
Disclaimer: This analysis is issued strictly for informational and educational purposes. Technical analysis based on historical price action does not guarantee future returns. Cryptocurrencies represent highly volatile and risky assets; conduct your own research before making investment decisions.
Communications Professional. Crypto Enthusiast. Economic Journalist. Bitcoiner & Altcoiner.