The digital asset market woke up this Monday under a dense fog of geopolitical uncertainty. As WTI climbed 8% to sit above $90 following the seizure of an Iranian freighter by the U.S. Navy and the closure of the Strait of Hormuz, bitcoin reflected global nervousness. The leading cryptocurrency retreated -2.50% at Sunday’s close, landing at $73,801.79, temporarily invalidating the breakout of a vital psychological resistance and forcing traders to reevaluate the strength of the current bullish micro-channel against a historic energy supply shock.
Oil as a Risk Catalyst
The escalation of conflict in the Middle East generated an energy supply shock that reignites inflationary fears. Tehran’s decision to retake control of Hormuz, combined with the postponement of negotiations with Washington, shifted capital toward traditional hedges, punishing risk assets. Bitcoin, which was attempting to consolidate its exit from a 189-bar bearish structure, hit a wall that was not only technical but macroeconomic.
Technical Analysis: The Battle at $76,000
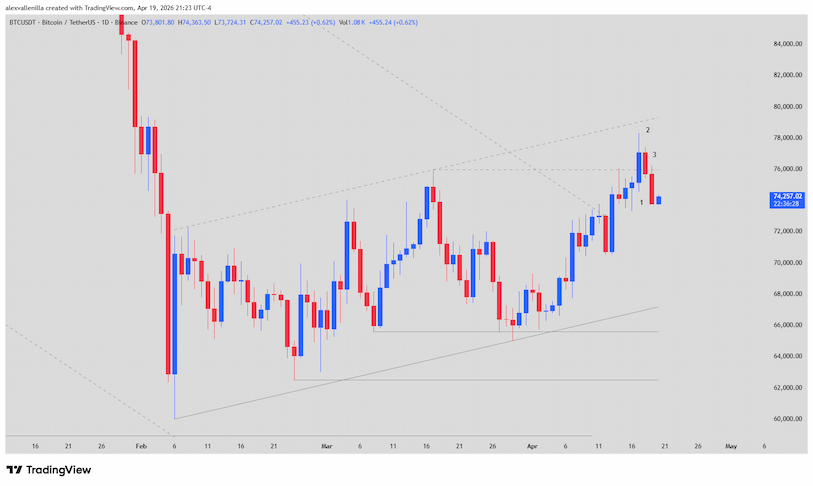
The daily chart presents a narrative of exhaustion following a two-legged bullish cycle. To understand the immediate future, we must dissect the behavior of recent sessions:
Bar 1 (The Failed Breakout): This was a bullish candle of intent that managed to pierce $76,000. However, the presence of an upper tail representing 50% of its body revealed heavy profit-taking. The fact that it did not reach the channel top suggests momentum stalled right in the “trapped sellers” zone from the previous cycle.
Bar 2 (Inside Bar): This internal bar acted as a Failed Breakout. By closing below the newly reclaimed support, it sent a warning signal: bulls were exhausted. Technically, it functioned as a Low 1, inviting bears to enter the market.
Bar 3 (The Geopolitical Throwback): A strong bearish candle with no lower wick, confirming the reversal. Although it broke the lows of the previous two bars, price found support before invading the prior congestion zone. This suggests we are facing a throwback (retest of support) rather than a structural collapse.
Market Outlook and Projections
The long-term bearish structure is technically invalidated, but price has entered a “digestion” phase. The magnetic target of $89,300 (resistance derived from January) remains active, but the path has become rocky.
Continuation Scenario: If the dynamic support of the 73-bar mini-channel holds price, we would see a fresh attack on $76,000.
Range Scenario: Volatility from the Hormuz conflict could keep bitcoin trading between $72,000 and $78,000 while the market absorbs inflation data stemming from crude oil.
Bitcoin is demonstrating a temporary inverse correlation with oil. The key for the week will be observing whether “value” buyers defend the $71,500 level; otherwise, the bullish micro-channel could break, forcing a retest of $65,600.
Disclaimer: This analysis is for informational and educational purposes. Cryptocurrencies are high-volatility assets. This does not constitute professional financial advice.
Communications Professional. Crypto Enthusiast. Economic Journalist. Bitcoiner & Altcoiner.