Solana (SOL) is at a pivotal crossroads in its market structure. After invalidating a prolonged downtrend, the asset has entered a defined trading range, attempting to pierce key resistance levels as bulls and bears clash in a high-volatility zone. Currently priced at $94.58, the high-performance network is testing investor patience.
The End of the Trend and the Birth of the Range
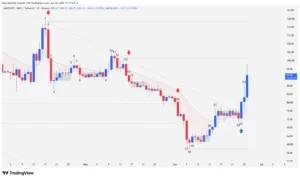
Markets do not move in straight lines. Following a decline that spanned 186 bars, Solana managed to stem the bleeding, entering what is technically known as a “Spike and Range” pattern. This transition suggests that selling momentum has exhausted itself, yet buyers still lack the necessary fuel to ignite a vertical rally. Currently, price action fluctuates between solid support at $79.00 and technical resistance at $97.68.
Bar-by-Bar Analysis: The Market Pulse
A detailed analysis of daily sessions reveals a narrative of failed attempts and market traps:
Bars 1 and 2: The move began with optimism. Bar 1 broke through previous congestion without resistance, while Bar 2 recorded a 3.33% gain, confirming the breakout with minimal overlap—a sign of institutional strength.
Bar 3: Bears attempted to regain control, but their efforts proved futile. The small candle body indicated that supply lacked the volume to reverse the previous momentum.
Bar 4: This was the key session. A powerful outside bar with a 4.06% advance “trapped” the sellers from the previous bar. By closing above the prior high of $90.73, bearish stop-losses triggered, serving as bullish fuel.
Technical Analysis: The Bar 5 Challenge and Current Rejection
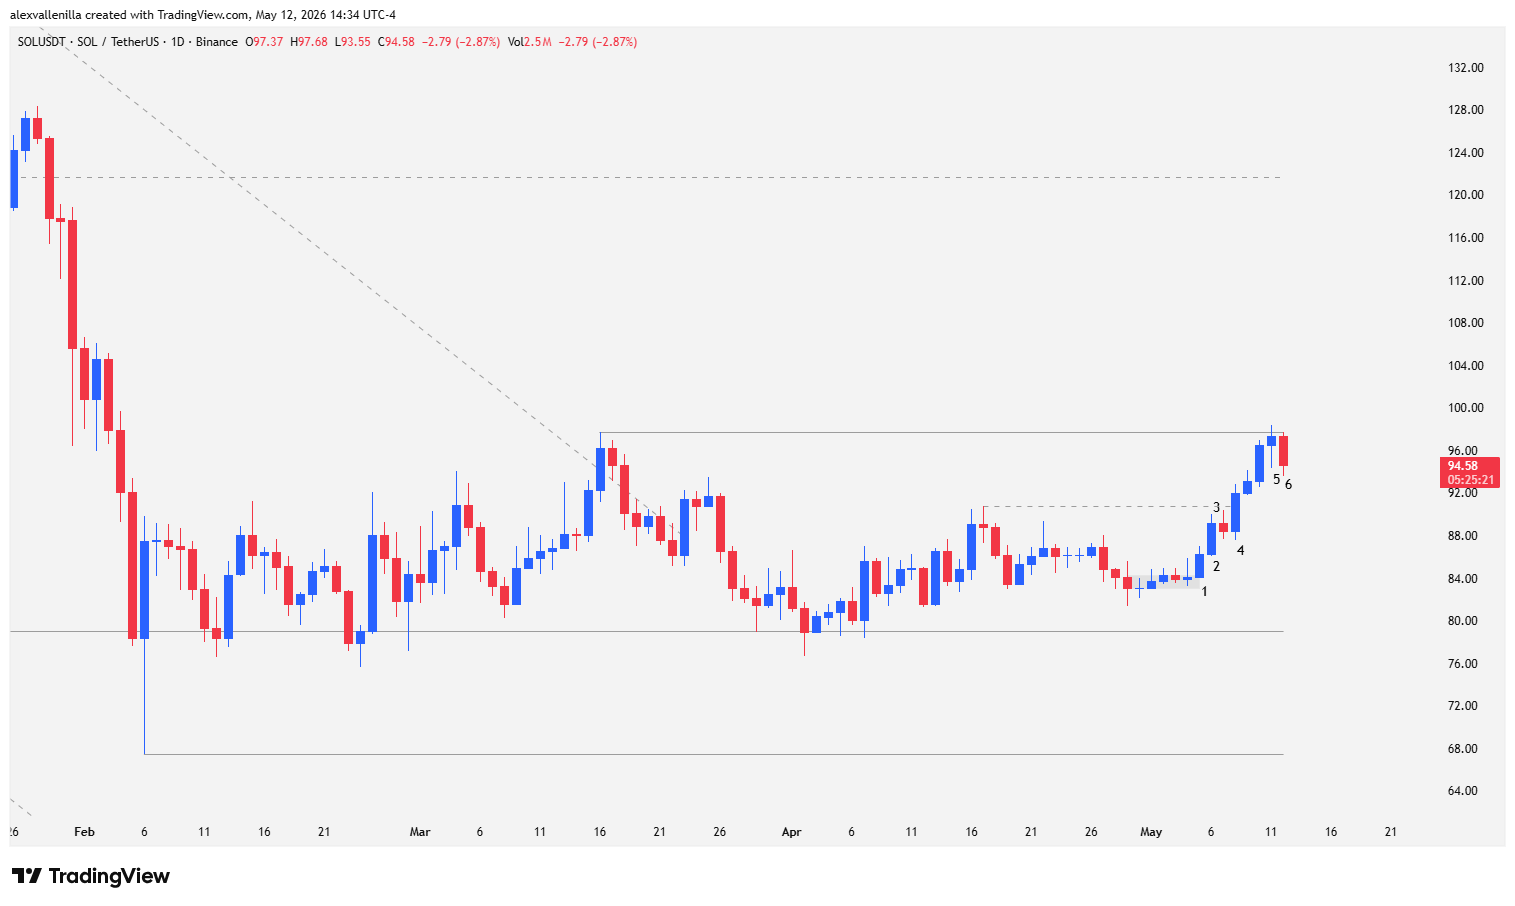
Bar 5 represents the climax of this sequence. A bullish pinbar formed with a lower wick twice the size of the body, demonstrating significant buy-side absorption. However, although price pierced the $97.68 resistance (the level marking the end of the macro downtrend), it failed to hold. The close below this level confirmed that, for now, the market remains trapped in its range structure.
In the current session (Bar 6), sentiment has shifted toward caution. Price is experiencing rejection in the supply zone, dropping 2.87% and breaking below the previous bar’s low. This move reinforces the thesis that Solana is in an accumulation or transition phase.
Projections: Where is SOL Headed?
If price finally manages to close above $97.68, the first technical target sits at $122, a level that coincides with a measured move projection following a breakout from the current range.
However, the true “final boss” for the bulls lies at $149. This is the last relevant lower high of the 186-bar downtrend. Clearing this mark would not only invalidate any potential bull traps but would also confirm the start of a new long-term ascending market structure.
Solana remains in a zone of precarious equilibrium. While it has moved past the free-fall phase, the inability to consolidate above $97 suggests the accumulation process could extend further. Traders should closely monitor the $79 support to rule out a deeper retracement.
Disclaimer: This analysis is for informational and educational purposes only. It does not constitute financial advice. Crypto asset investments carry high risk due to volatility. Trade responsibly.
Communications Professional. Crypto Enthusiast. Economic Journalist. Bitcoiner & Altcoiner.