The MUSD (M) cryptocurrency keeps the investor community on edge following a blistering rally that consolidated its primary bullish structure. In a session marked by high volatility, the crypto asset closed with a solid 10.94% gain, trading at $3.549 after breaking a 26-period minor bearish channel on its daily (1D) chart. Despite a deep prior correction that dragged the price back inside its long-term channel, aggressive supply absorption by smart money suggests that buyers are preparing a new assault on the key resistance at $4.0189, eyeing much more ambitious theoretical targets for the end of the quarter.
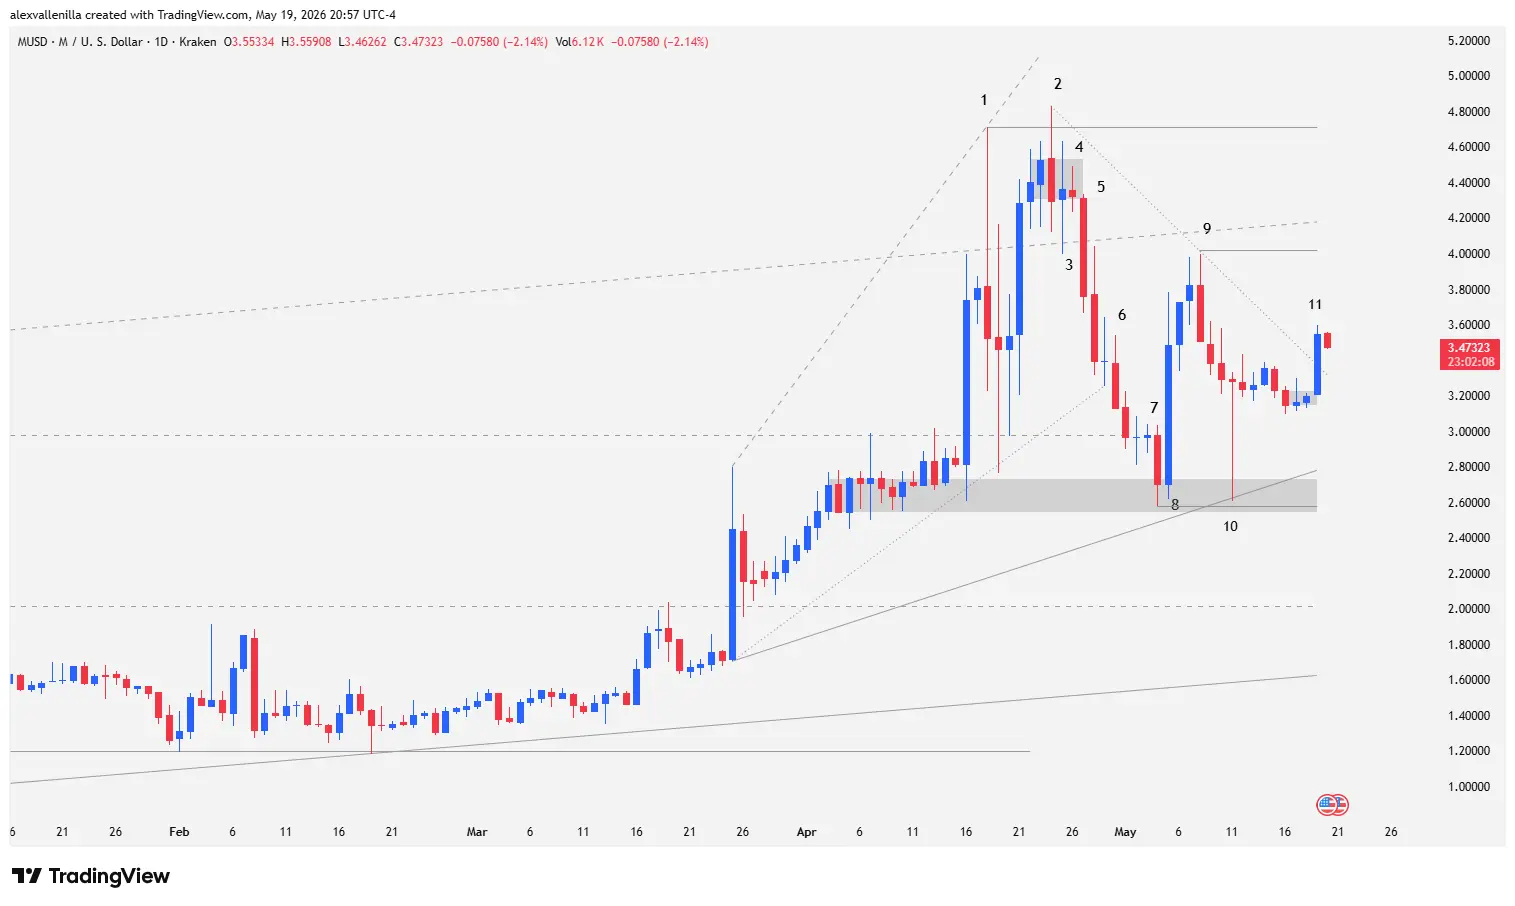
Chart Anatomy: The Bull and Bear Tug-of-War in MUSD/1D
Price action on the MUSD daily timeframe draws a classic scenario of accumulation, acceleration, and subsequent retests of macro structures. To understand the current technical landscape, breaking down the narrative that the candlesticks have built sequentially is imperative:
Detailed Technical Analysis (Candle by Candle)
Bar 2 (Rejection and Volatility): Following a powerful bullish impulse that managed to pierce the upper boundary of a 318-bar channel, the market experienced a bearish outside bar. This move swept liquidity but failed to consolidate, falling short in its attempt to break above resistance at $4.71 (the high of Bar 1). The massive volatility left prominent wicks on both ends, signaling the birth of a broadening wedge and clear buyer exhaustion in the upper zone.
Bar 3 (Lack of Continuity): A massive bullish-closing Doji printed with extremely long tails. Although bulls defended the dynamic support of the 318-bar macro channel, the fact that the high could not exceed that of Bar 2 confirmed that the rally needed a breather.
Bar 4 (Consolidation): An inside bar that functioned as a period of tight compression and a temporary price truce.
Bar 5 (Bearish Claws): Supply took absolute control with a violent -13.01% drop. This candle broke the congestion of the previous three days and returned the price inside the major bullish channel, registering retracement volume not seen since the start of the overall impulse.
Bar 6 (Minor Trend Piercing): The bleeding continued after a failed reversal attempt by the bulls. This candle closed “shaved” at its bottom (no lower wick), demonstrating seller urgency. The most relevant development was the break of the 35-bar bullish trendline, which formed the base of the broadening wedge.
Bar 7 (Support at $2.5809): After another buyer failure to stabilize the price, this bar extended losses to mark a critical floor at $2.5809, momentarily breaking a prior support at $2.9764.
Bar 8 (The Institutional Response): A radical 180-degree turn. Smart money stepped into the market, defending the support of Bar 7 with a massive 28.95% bullish candle. With an almost nonexistent lower wick, this bar caught bears in a clear bear trap and restored the price to the overall bullish bias.
Bar 9 (The $4.0189 Resistance): A bearish-closing outside bar with a small body that showed deceleration after the effort of Bar 8. Failing to test the ceiling of the 318-period channel, it established a fixed resistance at $4.0189, formally giving rise to a 26-bar minor bearish channel.
Bar 10 (Absorption Pinbar): Bears tried to force a capitulation, but demand absorbed all liquidity in the lower zone. The result was a massive bearish-closing pinbar with a prominent lower tail, which served to adjust the trendline of the ascending wedge.
Bar 11 (Breakout and Close at $3.549): Bulls validated the previous accumulation with a solid wide-range candle yielding 10.94%. Bar 11 successfully broke the trendline of the 26-period minor bearish channel, closing the session with notable buying conviction.
Market Projections and Targets: Heading to $7?
When evaluating the macrostructure, buying forces clearly carry heavier institutional weight. While bears have only managed to print one candle of true strength (Bar 5), bulls have accumulated three high-conviction impulses (the initial leg, Bar 8, and the recent Bar 11).
Currently, price is developing a 55-bar broadening wedge pattern. Since these patterns typically complete in two or three expanding expansion waves, analysis suggests a latent possibility for a new leg higher.
Bullish Scenario
If the momentum from Bar 11 maintains sustained capital inflows, the first major test lies in conquering the Bar 9 resistance at $4.0189, a zone that directly confluences with the dynamic macro channel resistance at $4.1771. Clearing the psychological and historic barrier of $4.71 via a measured move equivalent to the first bullish leg could allow MUSD to target a technical objective at $7.00 within an estimated eight-week timeframe.
Bearish Scenario
If buying volume fades near the ceiling of the minor channel, the cryptocurrency risks another sideways move. In this case, the fundamental support to watch remains unchanged at $2.5809, a historical congestion zone that proved to have sufficient institutional interest to repel supply attacks.
An Outstanding Performance in 2026
Beyond daily fluctuations, the macro perspective for MUSD (M) is undeniable. So far in 2026, the asset boasts a 120.73% return, a figure that becomes exponential when expanding the metric to the last full year, where it records extraordinary gains of 4773.93%. The technical breakout of Bar 11 puts the spotlight back on this ecosystem, consolidating it as one of the technological and financial projects with the highest traction in the digital generation’s portfolio.
Disclaimer: The information presented in this article is for educational and informational purposes only and does not constitute, under any circumstances, investment advice, financial recommendation, or an invitation to trade digital assets. Crypto assets carry a high risk of volatility and capital loss.
Communications Professional. Crypto Enthusiast. Economic Journalist. Bitcoiner & Altcoiner.