The privacy cryptocurrency market is undergoing a massive structural metamorphosis. Zcash (ZEC) is leading this strategic movement after consolidating a definitive shift in its macro trend on the daily (1D) timeframe. Following a prolonged 121-bar bear cycle, institutional buyers injected decisive capital volume to break historic resistances and reconfigure price action. Technical catalysts and market geometry suggest that the asset is not just seeking a cyclical recovery, but exploring unprecedented prices under a two-legged acceleration structure targeted toward medium-term technical objectives.
Price Action Anatomy: Bar-by-Bar Technical Breakdown
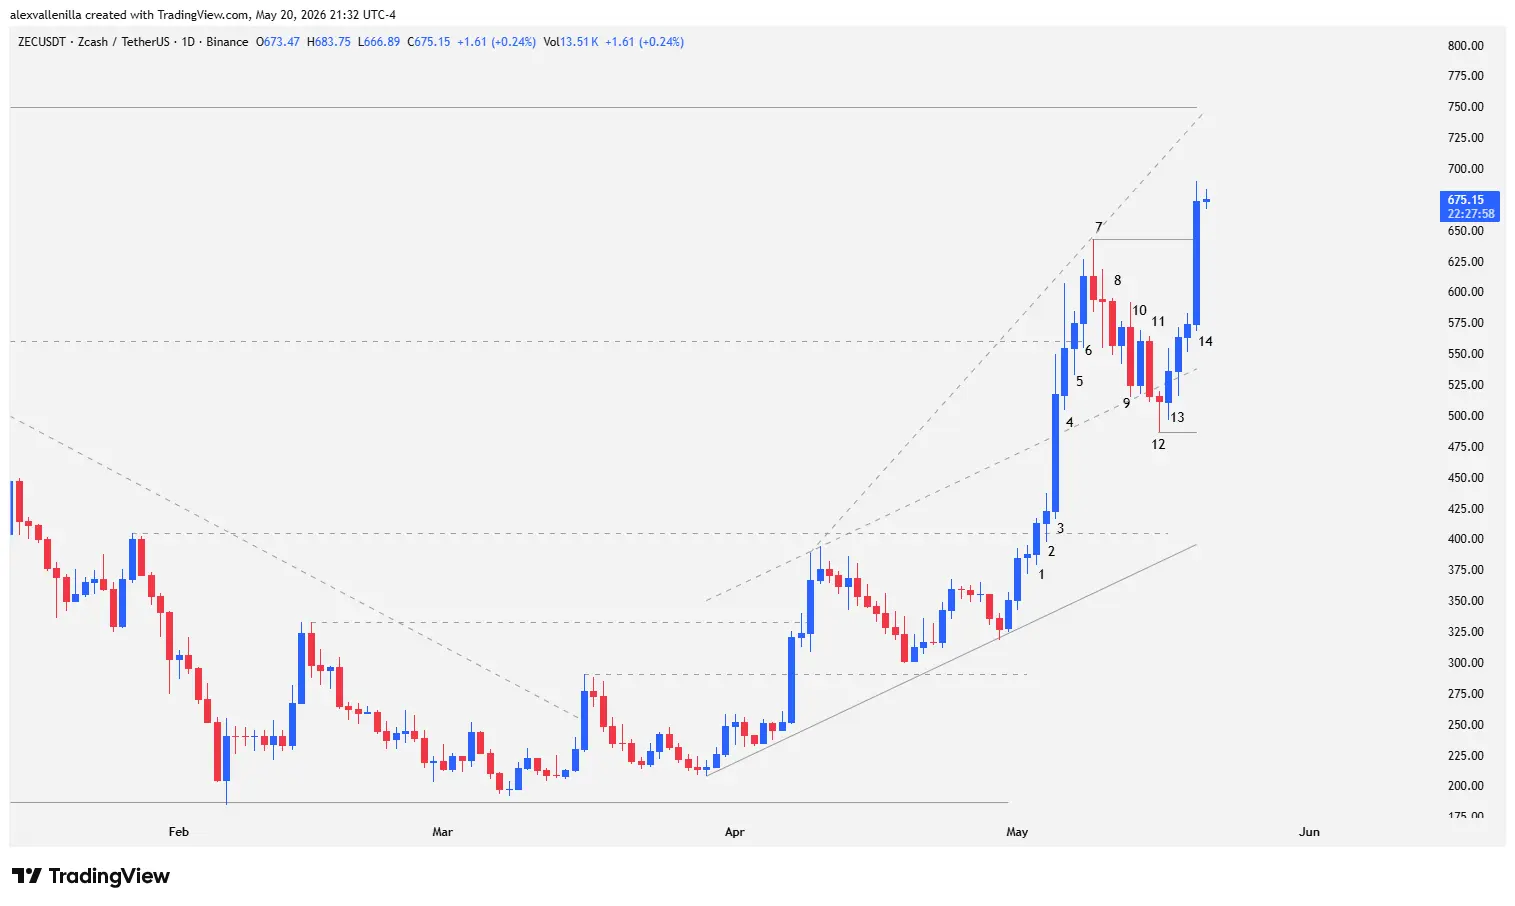
To understand trader psychology and liquidity transfer in this new Zcash cycle, we chronologically analyze the last 14 bars of the daily (1D) chart, where smart money assumed absolute control of the order book.
The Structural Shift and Institutional Momentum (Bars 1 to 3)
Bar 1: A wide-range bull candle provides continuity to the previous movement and aggressively sweeps the key resistance at $404.98, a relevant high that governed the prior 121-bar downtrend. This breakout officially invalidates the lower-highs structure, inaugurating a medium- and long-term bull cycle.
Bar 2: The price prints a small doji with a bullish close. The truly relevant aspect of this session is its location: the market respects the broken resistance at $404.98, validating it via the polarity principle as a highly reliable technical support.
Bar 3: Bulls deploy extreme aggressiveness. A massive momentum candle prints a 22.32% return, characterized by an enormous body and an almost non-existent lower wick. The low is solidly located above the new support. This is the second expansion bar since the origin of the current 52-bar trend, confirming the participation of whales and institutions. The close of this session breaches the upper boundary of the original ascending channel, accelerating market pace and triggering a broadening wedge.
Resistance, Volatility, and Exhaustion (Bars 4 to 7)
Bar 4: Volatility expands. Although buying pressure pushes the price to pierce the psychological resistance at $560, bears react. The session concludes with an upper wick significantly larger than the candle body, confirming massive profit-taking at the highs. Despite the victory of establishing a higher high, the price fails to close above that barrier.
Bar 5: An inside bar consolidation prints with a bullish close. During this operational breather, buyers absorb floating supply and finally manage to establish a daily close above $560.
Bar 6: A bullish candle maintains positive inertia. However, the block composed of Bars 4, 5, and 6 shows an evident loss of internal consistency. The heavy presence of wicks at the extremes and price dispersion reveal that the market is making a monumental effort for a diminishing result—a classic sign of technical exhaustion.
Bar 7: The market validates buyer fatigue with a pin bar printing a bearish close. The prominent upper wick establishes a new critical resistance zone at $643. Although selling pressure is not devastating (the price closes at the midpoint of Bar 6’s body), the structure halts the advance in its tracks. The following day is defined by a long-wicked doji that externalizes total confusion and indecision among traders.
The Critical Retracement and Liquidity Sweep (Bars 8 to 11)
Bar 8: Bears take the initiative and confirm the start of the correction phase through a solid down candle. Following the close, bulls attempt an immediate counterattack that culminates in a failed reversal.
Bar 9: An outside bar with a relevant body punishes the previous bullish failure. The bearish range of this session extends to test the top of the original ascending channel, a zone that now acts as dynamic support.
Bar 10: An inside bull bar is generated. Buy and sell orders completely overlap in a narrow area, evidence of a fierce battle and price congestion in a highly sensitive technical zone.
Bar 11: Bears break the temporary equilibrium with a bearish candle whose close pierces below the top of the ascending trend channel. By invalidating the reversal attempt of Bar 10, this session triggers alarm bells for traders facing the latent threat of a much deeper correction.
Selling Capitulation and the Bullish Climax (Bars 12 to 14)
Bar 12: The session opens with bearish continuity, but the drop is halted cold. The market prints a pin bar with a bearish close, featuring a considerable lower wick and a minuscule body. This technical pattern confirms that buyers absorbed all available supply in the lower area. The low of this bar establishes a definitive support at $486.61.
Bar 13: Facing the bearish weakness exposed the previous day, massive buy orders enter. This bullish reversal candle exceeds the high of Bar 12, drives the price up forcefully, and reintroduces it above the top of the ascending channel, regaining control of the scenario.
Bar 14: Bulls unleash an explosive session with a 17.35% intraday return. The candle’s power destroys the previous high of Bar 7 and establishes a decisive close at $673.54, above the $643 resistance. Due to extreme acceleration and the price position at the top of the development, this session possesses characteristics of a climax candle, suggesting the latent possibility of a minor breather or a healthy short-term consolidation. Notably, despite the strength of the move, the price has not yet tested the upper line of the broadening wedge.
Macroeconomic Projection: The Measured Move Toward $807
Current price action maps out a highly defined acceleration macrostructure. The fact that the low of Bar 12 ($486.61) did not need to seek the base of the ascending channel or the lower boundary of the broadening wedge demonstrates unusual buying urgency. This lack of a deep retracement confirms that the market is building a two-legged upward pattern (two-legged pullbacks or measured moves).
By projecting the magnitude of the first impulse (from Bar 1 to Bar 7) using the low of Bar 12 as an anchor point, algorithmic technical analysis establishes an identical measured move for the second leg.
This projection places the primary target at $807. On their way, bulls must face and breach the $750 level, a key psychological and technical resistance zone. If institutional volume manages to dissolve supply in that range, Zcash will formally enter a price discovery phase, extending the long-term cycle under the absolute control of market smart money.
The technical behavior of Zcash (ZEC) demonstrates that institutional money took control of the structure after a prolonged bearish slumber. Vertical and rapid impulses, contrasted with complex but shallow retracements like the one resolved in Bar 12, are the undeniable fingerprint of professional accumulation. If the price consolidates the breakout over $643, the technical path toward the two-legged bullish targets appears clear for the coming months.
Disclaimer: This analysis is for strictly informative and educational purposes, based on the technical interpretation of price action. It does not constitute, under any circumstances, financial investment advice, a recommendation, or an invitation to trade digital assets. Cryptocurrency markets exhibit extreme volatility; only risk capital you are willing to lose.
Communications Professional. Crypto Enthusiast. Economic Journalist. Bitcoiner & Altcoiner.