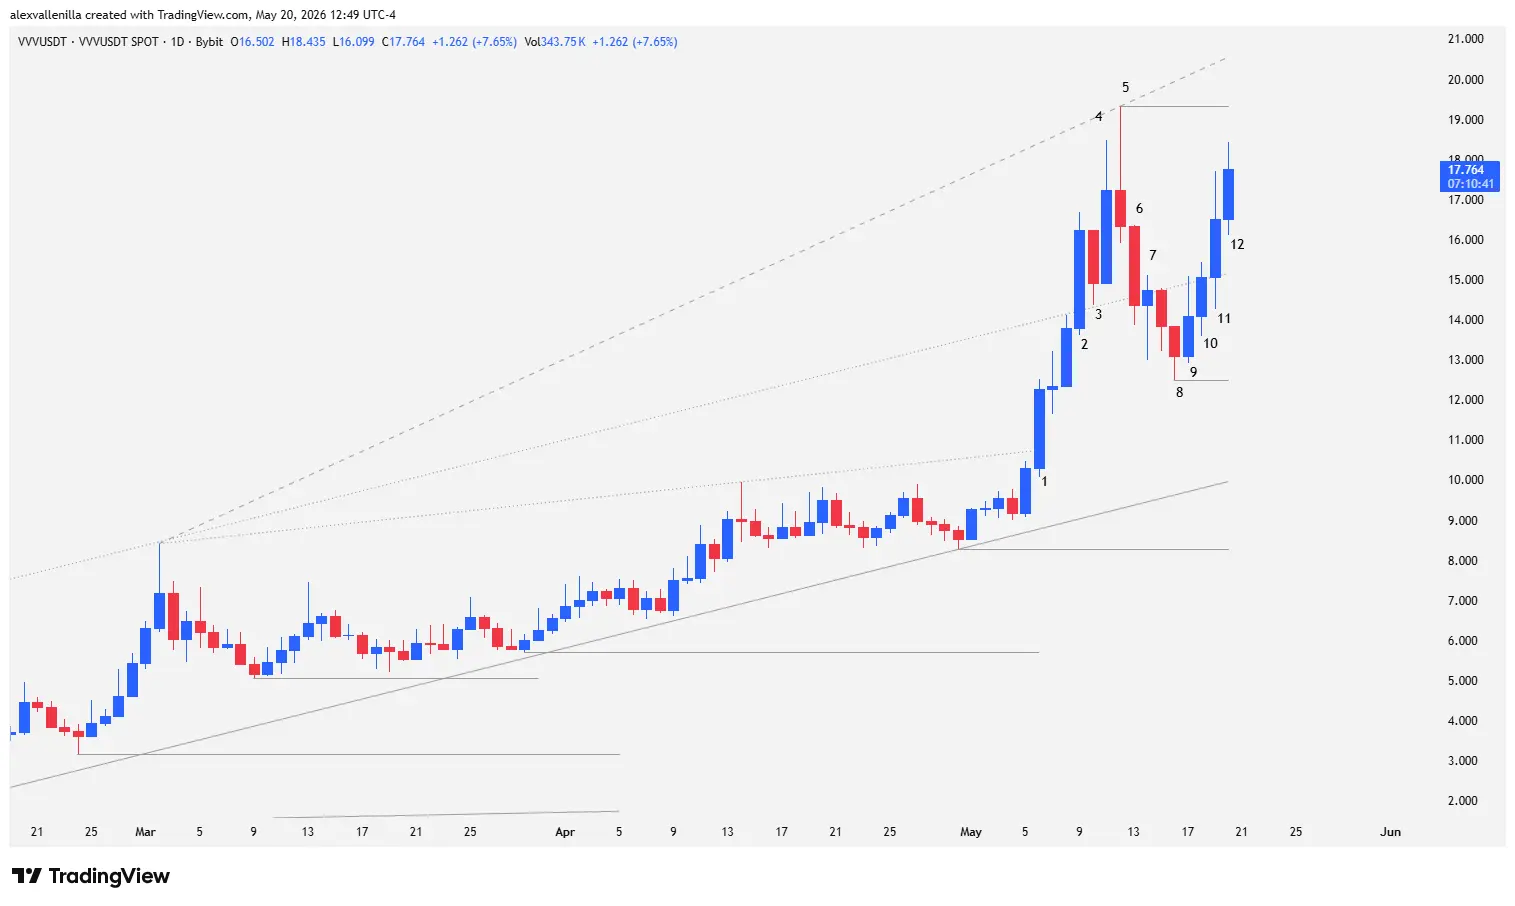
The crypto asset Venice Token (VVV) is capturing traders’ attention after staging a violent bullish breakout that shook its long-term technical structure. After compressing within an ascending wedge inside a 97-session ascending channel, institutional capital inflows fueled a massive breakout that drove the price to a new all-time high of $19.32. Despite a subsequent correction that dragged the price back below the channel’s former resistance, demand absorbed supply at $12.48, reactivating buying pressure that currently trades at $17.764. However, doubts regarding the sustainability of the current move are mounting due to a noticeable spike in volatility and a lack of structural solidity in the recent candlesticks.
Institutional Breakout Shatters 97-Session Structure
Venice Token’s (VVV) recent price action demonstrates how volume accumulation breaks even the tightest continuation structures. The asset maintained a structural uptrend for 97 bars, compressing into an ascending wedge due to a loss of momentum at the highs. This compression ended drastically when buyers took the initiative, breaching the main dynamic resistances backed by a substantial spike in trading volume.
The initial breakout invalidated the exhaustion scenario and shifted VVV’s technical bias. The move attracted smart money or institutional investors, who sustained the advance for several consecutive sessions without allowing significant pullbacks, accelerating the price into price discovery territory.
Chronicle of the 12 Bars: From Buying Climax to Current Uncertainty
The Initial Impulse and Channel Breakout (Bars 1 to 4)
Bar 1: This session posted a solid bullish candlestick with a remarkable 19.16% gain. The strength of the move allowed more than half of its body to close above the resistance line of the ascending wedge, marking the strongest impulse in the last 65 sessions and validating heavy capital inflows. Two subsequent bars confirmed continuity, testing the upper band of the main channel.
Bar 2: Buyers accelerated pressure with another 17.75% advance. This candlestick closed with almost no wicks on its extremes, positioning 90% of its body above the resistance of the 97-bar channel in a classic breakout move.
Bar 3: The market experienced a necessary technical breather through a bearish inside bar that reduced overheating and volatility. The session low respected the old channel resistance as dynamic support.
Bar 4: Bullish conviction returned with a shaved bottom candlestick, proving buyers dominated from the open to secure a 15.55% rally. However, the appearance of a pronounced upper wick signaled the first signs of profit-taking, though the session confirmed the failure of the sellers from Bar 3.
Climax, Throwback, and the Support Pivot (Bars 5 to 8)
Bar 5: Price action reached a climax via a large bearish pinbar. The extensive upper wick established a new all-time high at $19.32. This pivot altered market geometry, transforming the original channel into a broadening wedge along the lower trendline.
Bar 6: A solid 12.02% bearish candlestick extended the previous session’s retracement. The violence of the profit-taking dragged the close below the resistance of the 97-bar channel, completing a deep throwback and raising correction alarms.
Bar 7: Sellers attempted to extend the decline but faced heavy supply absorption. The result was a bullish pinbar with a notable lower wick that failed to generate immediate continuity.
Bar 8: Selling pressure slowed down through a small-bodied bearish inside bar with a pronounced lower wick. The lack of bearish continuity allowed for the establishment of critical support at $12.48, forming a higher low in the macro structure.
The Current Rebound and Loss of Consistency (Bars 9 to 12)
Bar 9: The bullish close of this session capitalized on the selling weakness of Bar 8, keeping its low safe and bringing the corrective leg to an end.
Bar 10: Buyers validated the reversal structure by confirming a pullback.
Bar 11: The session expanded the price range with a 9.56% rally. However, long wicks on both extremes revealed a high-volatility environment and an increase in operational risk due to the lack of clear direction.
Bar 12 (In progress): At the time of writing, the current candlestick is trading at $17.764 with a partial positive return of 7.65%. The price is looking to follow through on Bar 11’s advance and is heading to test the key resistance at $19.32.
Projections and Key Zones: Continuation or Distribution?
The current technical scenario for VVV presents a clear divergence between volume quality and candlestick development. The first impulse originating from Bar 1 exhibited solidity, decisiveness, and wide bodies reflecting absolute control by smart money. In contrast, the rebound underway since Bar 9 features persistent wicks at the highs and lows, suggesting an inconsistent liquidity sweep process that lacks the original conviction.
If buying pressure regains institutional homogeneity and breaks above the all-time high of $19.32, the structure will trigger a second bullish leg projection equivalent to the initial measured move. This technical target places VVV’s price at $22.94, an area that coincides with the upper band of the broadening wedge.
Conversely, if the current lack of consistency leads to a definitive rejection around $19.32, technical control will shift to the bears, leaving support at $12.48 (the low of Bar 8) as the final line of defense before a larger structural correction.
Venice Token stands at a high-volatility crossroads. The market demonstrated institutional interest by breaking the 97-bar structure, but erratic price action near all-time highs demands caution. The coming sessions will determine whether the weakness observed in the recent candlesticks is just noise before a rally toward $22.94 or the preamble to a larger distribution.
Disclaimer: This analysis is strictly for informational and educational purposes and does not constitute financial investment advice, recommendation, or invitation. Cryptocurrencies are highly volatile and risky assets. Every trader must conduct their own research (DYOR) before committing capital to the market.
Communications Professional. Crypto Enthusiast. Economic Journalist. Bitcoiner & Altcoiner.