The Hyperliquid (HYPE) market is experiencing crucial hours after registering heavy volatility on its daily (1D) chart. Following an impressive bullish rally that pierced the upper boundary of its main structure, violent profit-taking by “strong hands” triggered a 13.57% pullback in a single session. Buyers are currently fighting tooth and nail to defend critical support at $52.67, while the order flow reflects an intense dispute for control of the short-term trend.
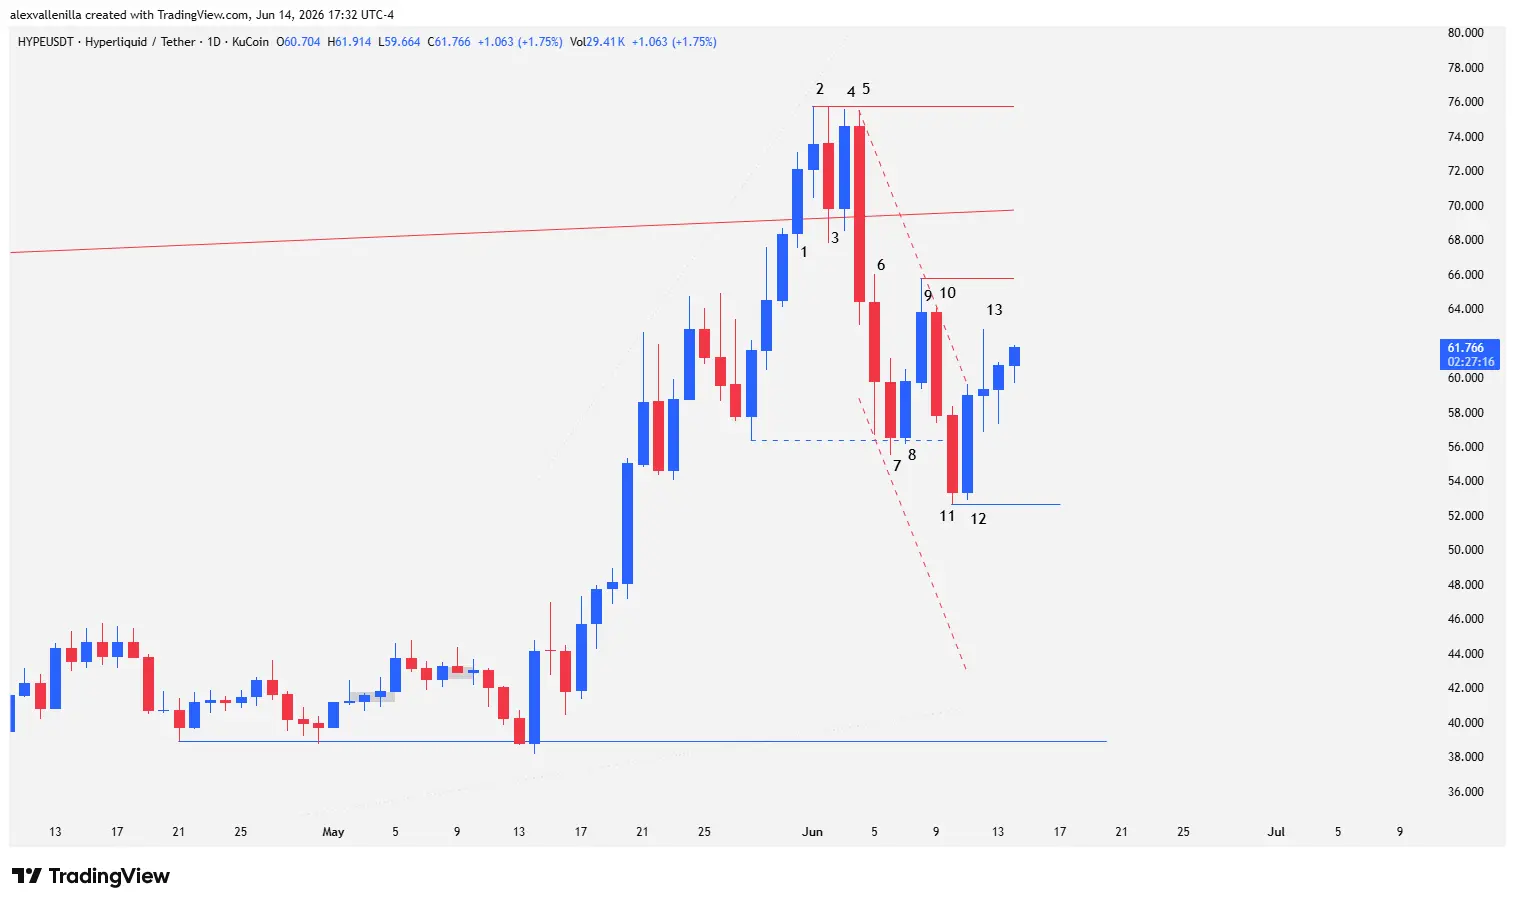
Price Action Radiography: Bar-by-Bar Analysis
To understand market psychology and trader behavior, we break down the recent candlestick sequence in detail:
The Breakout and the Onset of Doubt (Bars 1 to 4)
Bar 1: Buyers show massive strength by breaking above the upper boundary of a main ascending canal that spanned 433 bars. This action signaled extreme price acceleration.
Bar 2: Although the candlestick provides continuity to the move and closes above the previous high, it finishes as a doji. Traders show indecision just as the asset establishes historical resistance at $75.757. Despite validating the technical breakout, the two-legged bullish structure within a 21-bar microcanal suggested momentum exhaustion.
Bar 3: The market begins a pullback. Sellers push the price downward, temporarily piercing the upper boundary of the 433-bar canal (former resistance now acting as dynamic support). However, the close remains above this trendline, limiting the damage.
Bar 4: Bulls attempt to regain control but only manage to print an inside bar. A lack of volume prevents testing the resistance at $75.757, confirming that the initial breakout lacks solid follow-through, though it temporarily invalidates the bearish strength of the previous candlestick.
Short-Term Institutional Capitulation (Bars 5 to 7)
Bar 5: Strong hands execute massive profit-taking. This wide-range candlestick with bearish conviction plunges the price 13.57%, leaving almost non-existent wicks. By closing below the 21-bar acceleration microcanal, institutionals decreed the end of the immediate bullish phase.
Bar 6: Bears maintain the pressure and extend the drop. Nonetheless, buyers block the price before it can test critical local support at $56.36, which represents the control point and anchor of the previous move.
Bar 7: Bears attempt to pierce $56.36. Although they achieve a lower low than Bar 6, the close sits above support. The candlestick body shrinks drastically and overlaps almost completely with the previous range, exhibiting a clear deceleration of the downward move that invites bargain hunters into the market.
The Reversal Game and the Bearish Counterattack (Bars 8 to 13)
Bar 8: A bullish inside bar consolidates. The reduction in volatility allows buyers to successfully defend the $56.36 level, setting the stage for a bounce.
Bar 9: The candlestick confirms the reversal, but the upper wick reveals that sellers remain active in the higher zones. Momentum stalls before clearing the high of Bar 6, establishing local resistance at $65.78.
Bar 10: Detecting bullish weakness, bears attack with force. This candlestick completely engulfs the body of Bar 9, confirming a two-bar reversal failure. The high of this session serves as an anchor to plot a new short-term bearish microcanal.
Bar 11: Selling pressure finally breaks decisively through the $56.36 support. Even though sell orders cover the entire range, the small size of the candlestick shows that bearish fuel is beginning to run dry. The low establishes a new line of defense at $52.67.
Bar 12: Bulls respond aggressively with a 10.56% rally, breaking above the previous high and trapping traders who shorted late on Bar 11. The price tests the top of the bearish microcanal and respects support at $52.67.
Bar 13: The market closes with a high-indecision doji. Although the candlestick manages to pierce the trendline of the 7-bar bearish microcanal, absolute parity between supply and demand leaves the outlook open and without a clear definition.
Market Outlook: Key Levels to Watch
The rejection at the top of the 433-bar canal proves that overbought levels were unsustainable without a structural pause. The absence of a massive capitulation phase suggests the market is simply undergoing a healthy correction.
If bullish order flow manages to push the price above local resistance at $65.78, HYPE will gain the necessary traction to target $75.757 once again. Conversely, if supply invalidates the current support at $52.67, the technical scenario will favor a deeper correction toward $38.89, the zone where the lower boundary of the main ascending canal rests.
Disclaimer: This analysis is presented for informational and educational purposes only. It does not constitute financial advice or an investment recommendation. Crypto assets exhibit high volatility; conduct your own research before trading.
Communications Professional. Crypto Enthusiast. Economic Journalist. Bitcoiner & Altcoiner.