The crypto ecosystem is witnessing a highly relevant technical milestone. Over the last few days, Hyperliquid (HYPE) consolidated a massive structural breakout on its daily (1D) chart, driven by institutional capital inflows and dominant buying pressure. After successfully piercing historical resistance at $59.56, the asset neutralized profit-taking attempts and accelerated its price to print a new All-Time High (ATH) at $74.64. At the time of writing, buying pressure keeps the price in the $72.835 zone, confirming that bulls retain absolute control of the order flow amid strong macroeconomic expansion.
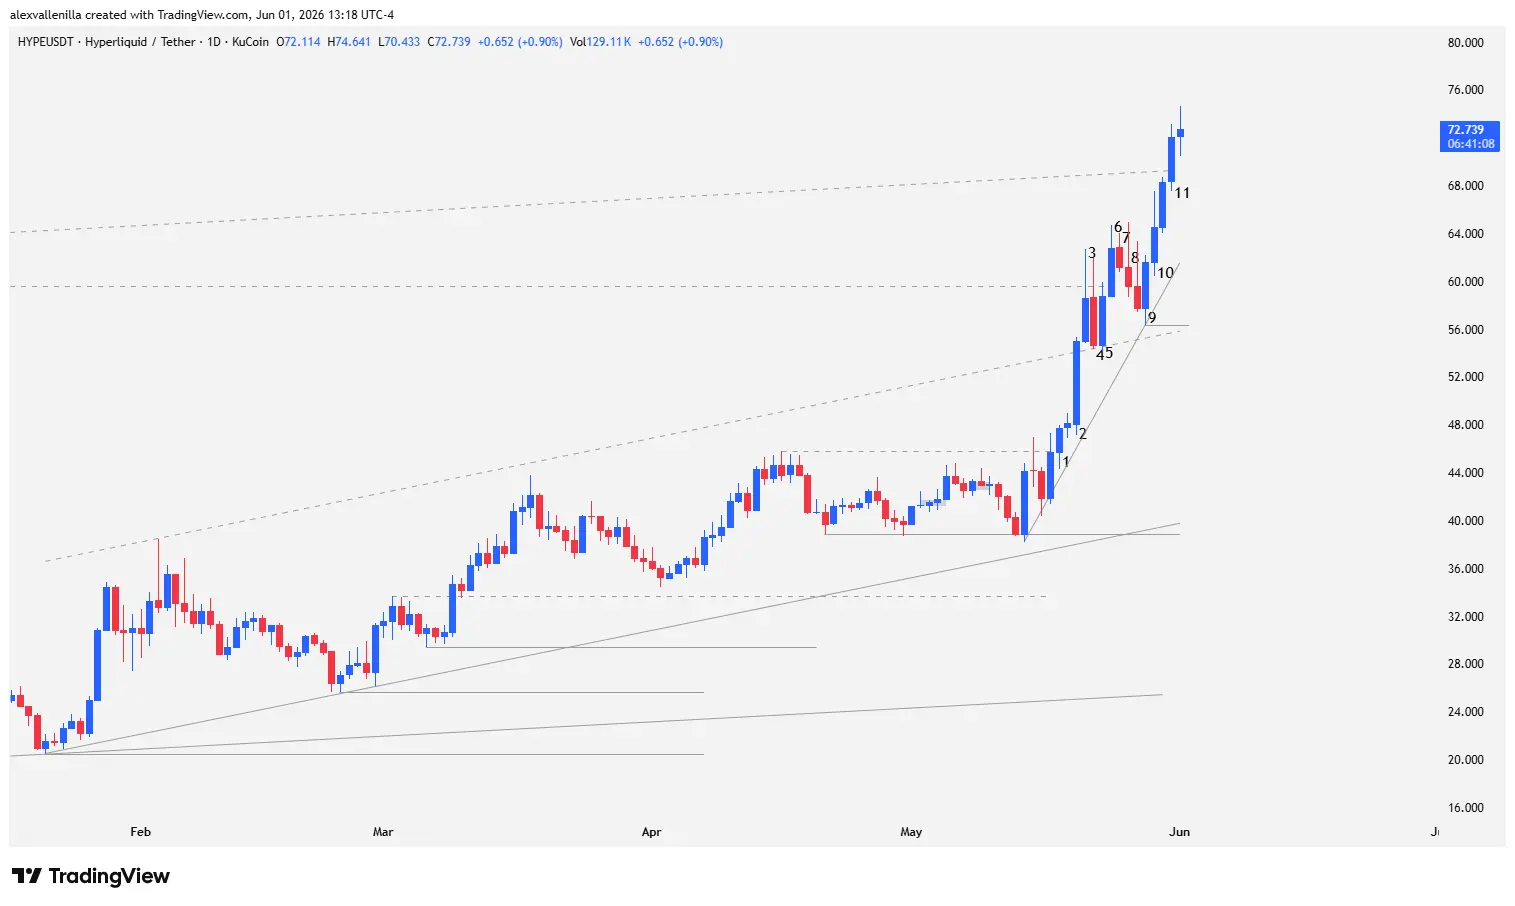
Macro Structure: From Secondary Trend to Escape Velocity
To understand the magnitude of this move, breaking down the chart architecture is essential. HYPE operates within a 418-bar primary bullish trend, which dictates the long-term bias. Within this matrix, the price was moving inside a 131-bar secondary ascending channel.
The most recent price action reveals a high-conviction phenomenon: a transition into a 18-bar accelerated tertiary move. This latest technical fractal consists of two perfectly defined bullish legs, separated by an accumulation and rest phase between Bar 3 and Bar 9. By piercing the ceiling of the main ascending channel, the asset enters a “price discovery” dynamic, validating an acceleration that typically precedes parabolic rallies.
Candlestick Reading: The Price Action X-Ray
The Initial Breakout and Institutional Injection (Bars 1 and 2)
Bar 1: This session shapes up as a minor bullish bar that strategically closes above previous resistance at $45.77, breaking a sideways accumulation range. The following day acts as a minor confirmation candle.
Bar 2: A powerful, wide-range bar appears with a 14.33% impulse. The near-total absence of upper and lower wicks (tails) reveals a systematic execution of buy orders. This pattern denotes the direct entry of “strong hands” (institutional capital) propelling the price past the upper limit of the 131-bar channel.
The Battle at All-Time Highs and Fakeouts (Bars 3 to 6)
Bar 3: Buyers extend the momentum and intercept the old all-time high of $59.56. Although order flow pierces this level, the appearance of a prominent upper tail—matching the size of the body—betrays massive profit-taking. Despite the selling pressure, the close sits above the channel ceiling, sustaining the bullish bias.
Bar 4: This prints as a bearish, engulfing close. Bears manage to breach the low of Bar 3, threatening a deep retracement. However, the daily close defends above the channel’s dynamic support, limiting structural damage.
Bar 5: A highly educational session. Buyers assume control right from the open, showing a non-existent lower tail and defending the structure. When attacking $59.56, the upper wick is tiny, proving that the floating supply from Bars 3 and 4 has been completely absorbed.
Bar 6: A strong conviction candle with a 6.86% expansion. With no lower wick, bulls dominate the market from the very first minute. For the first time, the close sits convincingly above $59.56, establishing an intermediate peak at $64.72.
Consolidation, Structural Reset, and New Impulses (Bars 7 to 11)
Bars 7 and 8: Bar 7 shows up as an inside bar of indecision. Bar 8 evolves into an outside bar with a bearish close and a prominent upper tail, extending the pullback into a three-candle corrective pattern (including the session after Bar 8). Temporary profit-taking cools down derivative indicators but respects the chart geometry.
Bar 9: This stops the bleeding. This bullish closing bar lacks the strength of previous impulses, but its low functions as a crucial pivot. From this point, technical analysis plots the new trendline for the 18-bar tertiary move.
Bar 10: A bullish confirmation candle that engulfs and cancels out the highs of Bars 7 and 8, completely invalidating the corrective scenario and marking a milestone at $67.56.
Bar 11: This prints a more moderate advance of 5.50%. It shows tails on both ends, pointing to a natural deceleration after the buying effort. However, the most relevant technical data point is that it manages to close above the upper band of the main 418-bar ascending channel, certifying a change in market speed.
Flow Outlook and Key Levels
Hyperliquid’s behavior paints a flawless technical scenario where past resistance becomes present support. If price consolidates current trading above the general channel ceiling, the discovery process will continue without fixed technical targets in the short term.
In the event of a natural correction following this rally, the low of Bar 9 consolidates as critical structural support. This level confluences with mathematical precision with the old upper limit of the 131-bar secondary channel, now transformed into major dynamic support at $55.82. As long as price trades above this zone, the bullish structure remains intact.
Price action in Hyperliquid (HYPE) demonstrates how pure candlestick and order flow analysis anticipates institutional moves. Conquering the new high at $74.64 is not an isolated event, but the technical result of systematic supply absorption that positions the asset in a strong bullish acceleration phase heading into the end of the cycle.
Disclaimer: The information presented in this analysis is for informational and educational purposes only and does not constitute, under any circumstances, investment advice or financial recommendation.
Communications Professional. Crypto Enthusiast. Economic Journalist. Bitcoiner & Altcoiner.