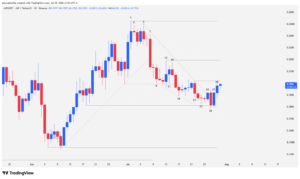
The artificial intelligence crypto market is experiencing a notable capital rotation during this second quarter of 2026, positioning SKYAI right in the spotlight for institutional analysts. After posting an impressive 1,122% annualized return and a 902% year-to-date gain, the crypto asset is consolidating positions in a “Spike and Range” chart pattern. Price action on the daily chart (1d) reveals a key structural compression between macro support at $0.1550 and local resistance at $0.3865, anticipating an imminent expansive move.
Market Climax and the Origin of the Macro Correction
SKYAI’s recent trajectory illustrates textbook crowd psychology and institutional order flow. The token hit its all-time high (ATH) at $0.8614 following a parabolic, climax-like acceleration. However, pure technical analysis of the Japanese candlesticks was already warning of exhausting late-stage buying pressure.
Bar 1 printed an unmistakable bearish pin bar with a prominent upper wick and a tiny body, confirming the presence of an institutional block of sell orders. The two previous sessions validated this liquidity absorption, as they also printed upper tails. Bearish continuity materialized in bar 2 (making a lower high) and bar 3, an inside consolidation candle that momentarily contracted volatility.
Buyers failed to regain control in bar 4, generating an outside candle with a massive upper wick that revealed smart money was still liquidating inventory. Confirmation of the failed reversal came with bar 5, which trapped late bulls and broke below the base of the previous 12-bar structural ascending channel.
Technical Anatomy: The Development of the 26-Bar Downtrend
The Channel Breakdown and the Search for Local Support
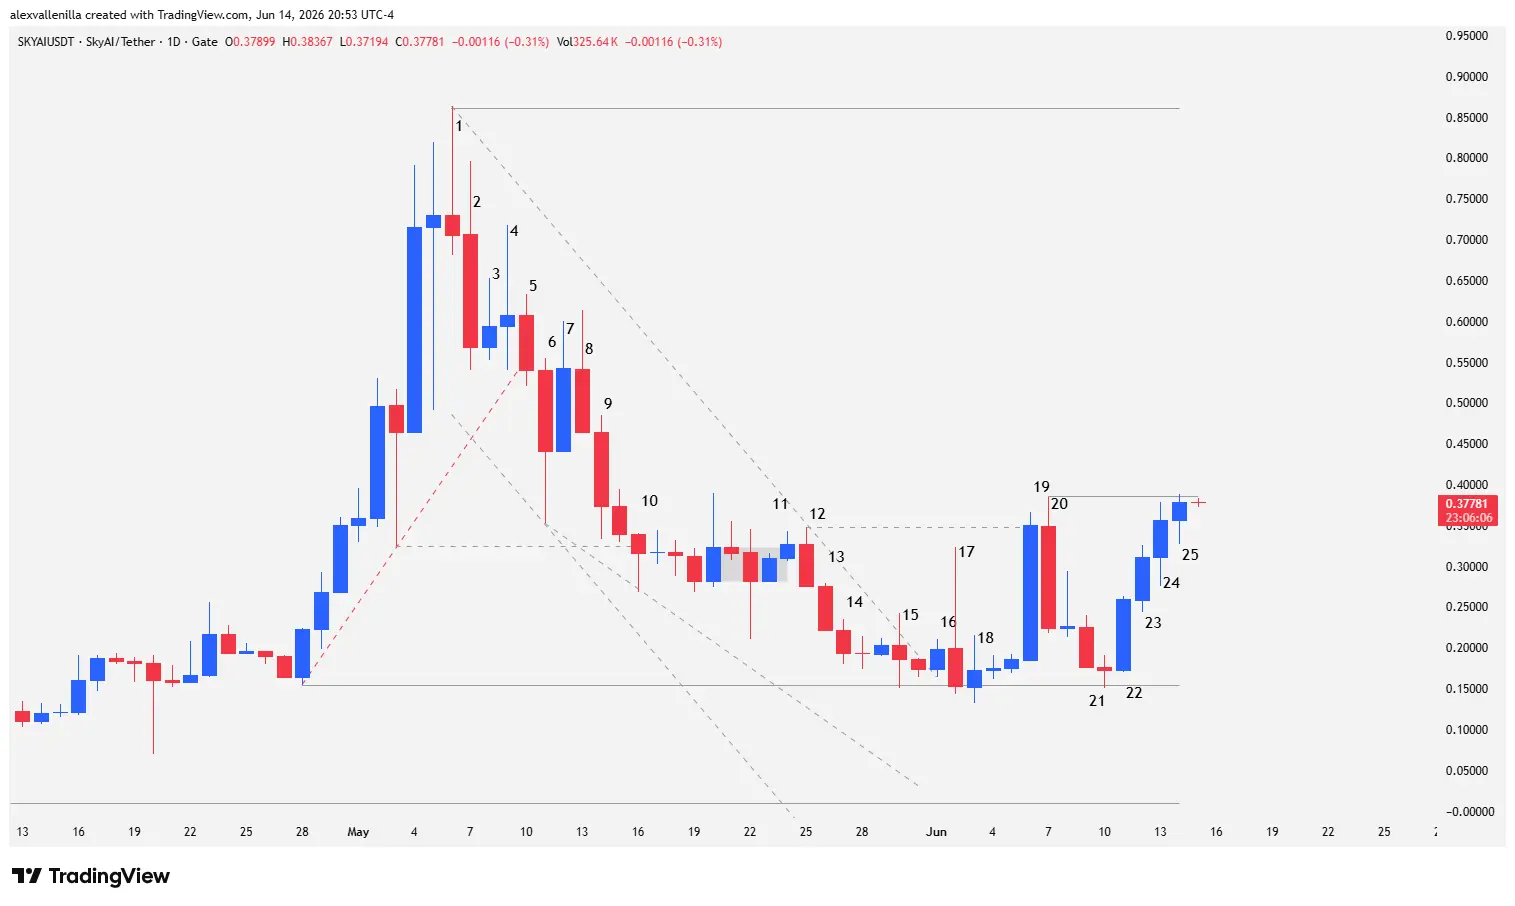
Selling pressure extended the drop in bar 6, closing below the previous low with zero overlap, which anchored the secondary 26-bar descending channel. Although this session attempted to test the broken channel’s control point at $0.3252, supply was partially absorbed by a lower tail proportional to its body.
The buyers’ inefficiency became glaringly obvious between bars 7 and 9:
Bar 7 attempted a bullish reversal, but its flat close failed to breach the previous high.
Bar 8 neutralized the prior bounce with an upper wick that validated the rejection.
Bar 9 confirmed the buyers’ failure by providing downside continuity, though it stopped short of reaching the $0.3252 support.
The Compression Pattern and the Falling Wedge
Bears finally broke through $0.3252 in bar 10. However, the shrinking range of the candle bodies since the eighth session of the cycle signaled a clear deceleration in selling momentum. This volatility contraction led to a 5-bar congestion phase. The low of bar 10 served as an anchor to draw a descending trendline which, combined with the upper boundary of the 26-bar channel, formed a falling wedge.
The attempted breakout from the congestion in bar 11 was immediately wiped out by bar 12, an outside candle that trapped buyers and set a swing high at the $0.3480 resistance. From this point, bearish inertia extended through bar 13 and bar 14, closing in on the last bullish stronghold: the peak of the prior impulse located at $0.1550.
Bar 15 (an outside doji) precisely tested this critical level without breaking it, triggering a defensive sideways phase.
The Turning Point: Institutional Intervention and the Double Bottom
Bar 16 generated a technical breakout above the wedge’s descending trendline, trading within a tight range while keeping the floor intact. The real clash between supply and demand occurred in bar 17: a violent, expanded-range pin bar that momentarily pierced $0.1550, sweeping retail stop-losses before aggressive institutional buying blocks repelled the move.
The response from smart money solidified the structure:
Bar 18 absorbed residual selling, invalidating bearish continuity and trapping late sellers.
Bar 19 injected massive institutional volume, resulting in a high-conviction candle that posted an 88.38% vertical surge with no lower wick, blasting through the previous resistance at $0.3480.
Bar 20 marked a pause at $0.3865 due to aggressive profit-taking, opening a minor three-bar pullback with decreasing ranges.
Bar 21 printed a small doji that retested the $0.1550 level for a second time. In price action trading, a second failed selling attempt usually triggers the opposite move.
Bar 22 capitalized on this structural weakness with another wide-range candle backed by institutional conviction, confirming the validity of the Double Bottom pattern alongside bar 18.
Bars 23, 24, and 25 maintained the bullish sequence. However, bar 25 showed a loss of momentum by printing a visibly smaller body than its predecessors and failing to close above $0.3865, suggesting a healthy short-term technical correction.
Summary and Market Outlook
SKYAI sits in a highly significant transition zone within the geometry of a “Spike and Range” pattern. The fierce defense of the $0.1550 institutional support by smart money tilts the odds toward a bullish scenario over the medium term.
If buyers manage to absorb the current resistance at $0.3865 and consolidate the price above the high of bar 19, projections point to the start of a two-legged measured move expansion. This technical layout would target the liquidity exposed during the previous downtrend, aiming for a ultimate return to its all-time high of $0.8614. Otherwise, a structural failure will send the price back into the trading range to continue accumulating orders at the base of the range.
Disclaimer: The information presented in this analysis is strictly for educational and journalistic purposes. It does not constitute financial advice, investment recommendations, or a formal invitation to trade digital assets. Cryptocurrency markets exhibit high volatility; only risk capital you are willing to lose.
Communications Professional. Crypto Enthusiast. Economic Journalist. Bitcoiner & Altcoiner.