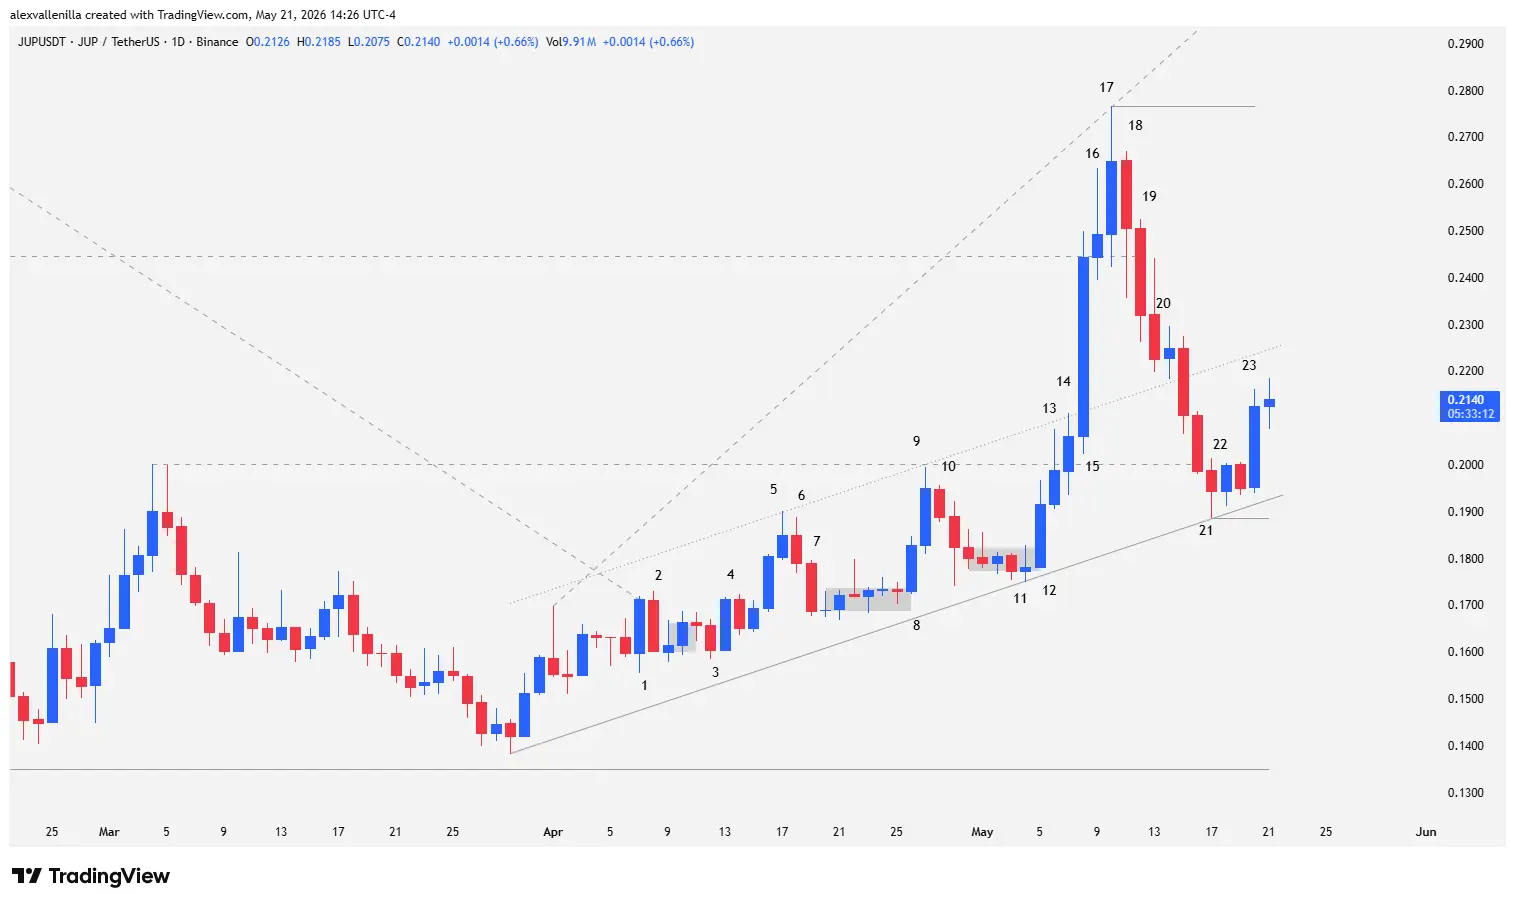
The cryptocurrency market offers no truce, and the JUP token daily chart (1D) delivers a masterclass in price action. After remaining trapped within a 779-bar bearish macrostructure, the asset began signaling signs of life through a nascent 54-bar ascending channel. Driven moderately and progressively by institutional investors or “smart money,” this movement successfully broke an internal descending trendline that had dominated price action for 259 sessions. However, in the crypto ecosystem, glory is never achieved without fierce resistance. JUP is currently locked in a broadening wedge formation, where extreme volatility and profit-taking threaten to neutralize the buyers’ efforts.
Anatomy of Price Action: Bar-by-Bar Technical Analysis
To understand where JUP is headed, we must break down the technical narrative that algorithms and institutional traders have printed on the daily chart. Every Japanese candlestick tells a story in this territorial dispute between supply and demand.
The Awakening and Initial Breakout Failures (Bars 1 to 3)
Bar 1: Buyers enter the market with determination, printing a consistent bullish candle that posts a 7.13% gain. This move halts and breaks the descending trendline of the 259-bar channel (the second leg of the macro decline).
Bar 2: The response from supply is immediate. Bears trigger a 6.48% retracement, pushing the close back below the broken trendline and setting up a breakout failure. Although the subsequent candle operates as a bullish pinbar with an upper tail and a shaved bottom (demonstrating initial selling control), the price stalls after Bar 2 into a three-session sideways congestion phase.
Bar 3: Sellers attempt to extend the decline by breaking out of the congestion, but their effort lacks volume. The low of Bar 3 fails to test the floor of Bar 1, establishing a higher low that formally gives birth to the nascent 54-bar uptrend.
Accumulation and the $0.200 Psychological Resistance (Bars 4 to 7)
Bar 4: Selling weakness attracts fresh capital. A solid candle prints with almost no tails, marking a 6.80% rally that clears previous highs and traps short sellers from the prior session. This evidence points to moderate accumulation by smart money.
Bar 5: The advance loses steam. The candle exhibits a small body and a pronounced upper tail, failing to reach the $0.200 resistance. This peak serves as the anchor point to project the upper boundary of the ascending channel.
Bar 6: Buyer exhaustion is confirmed with a bearish reversal candle.
Bar 7: Pressure intensifies with a 5.75% decline with no tails, stoking fears of a bull trap. Nonetheless, the low holds above the 54-bar bullish trendline. The price enters a “barbed wire” congestion pattern for six sessions, anticipating a two-legged move upward.
Momentum, Confirmation, and Supply Absorption (Bars 8 to 11)
Bar 8: A congestion breakout candle with a shaved bottom. Smart money accumulates at higher prices, protecting the trendline.
Bar 9: Bullish continuity delivers a 6.62% appreciation. The buyer trap hypothesis is invalidated, and although bears defend the $0.200 zone by leaving an upper tail, the high validates the top of the ascending channel.
Bar 10 and Bar 11: Bar 10 acts as a small bearish inside bar that begins a controlled retracement. Demand absorbs the latent supply, and the low of Bar 11 redefines the dynamic support of the 54-session channel with precision.
Climactic Expansion and Extreme Volatility (Bars 12 to 17)
Bar 12: A strong 7.58% move with a shaved bottom. Institutional money pushes the price upward, though the close fails to breach the high of Bar 9.
Bar 13: Bulls pierce $0.200 for the first time, but the appearance of an upper tail identical in size to the body highlights the massive effort required.
Bar 14: A weak close with high indecision, but technically valuable as it sits above $0.200, consolidating the breakout.
Bar 15: A brutal explosion of strength. JUP skyrockets 18.59% in a climactic acceleration candle that pierces the top of the ascending channel. The body closes above the $0.200 resistance (now turned support), and the high manages to poke through the $0.2446 resistance, which corresponds to the highs of the 259-bar downtrend.
Bar 16: As usual after a buying climax, exhaustion sets in. A pinbar emerges with an upper tail doubling the body size, signaling massive profit-taking despite closing above $0.2446.
Bar 17: An extreme volatility session with massive tails on both ends and a 6.26% price range. The high volume traded outlines a high-liquidity zone. The high of this candle establishes a static resistance at $0.2766 and draws the upper boundary of a broadening wedge.
Deep Correction and the Resurgence of Demand (Bars 18 to 23)
Bar 18: Bears take the initiative. Although buyers defend $0.2446 by leaving a lower tail, the low of the bar violates the lows of the two previous sessions, exposing bullish vulnerability within the context of the 779-bar major countertrend.
Bar 19: A large-bodied bearish candle crashes the price by 7.42%, confirming the start of a severe technical adjustment.
Bar 20: A tiny doji attempts to stop the bleeding at the upper part of the 54-bar channel, but the next session invalidates the defensive pivot. Price re-enters the ascending channel, completely wiping out the gains from the climactic candle (Bar 15).
Bar 21: A bearish close doji whose low simultaneously tests the ascending channel floor and the broadening wedge base. It establishes critical support at $0.1886 after losing the $0.200 pivot.
Bar 22: A bullish inside bar that halts buyer capitulation in its tracks and cancels bearish continuity.
Bar 23: The structure reacts. Bulls retake the wheel with a powerful 9.03% impulse. The low of the candle respects the bullish trendline (marking another higher low), while the high clears the previous congestion levels, returning operational control to the buyers.
Context Perspective: Market Trap or Structural Pivot?
The current behavior of JUP must be analyzed through the lens of fractals. On the macro scale (779 bars), the recent bullish move is a countertrend. The violent retracement from Bar 17 can be classified as a macro bull trap, given that in very long-term trends, whales typically use rallies to distribute their positions.
However, in the short-to-medium term, the breakout of the 259-bar line triggered a climax and trend pattern. The resilience of the support zone between $0.1886 and $0.1750 (control points of the 54-bar channel) is key.
If price action successfully consolidates the current structure and builds the second leg of the broadening wedge, technical targets will activate in a cascade: first, beating $0.2766; next, targeting key resistance at $0.4543; and finally, confluencing with the dynamic resistance of the main descending channel at $0.5598. Conversely, losing $0.1750 would invalidate the recovery scenario, opening the door to fresh historical lows.
Disclaimer: This analysis is strictly for informational and educational purposes. It does not constitute, nor should it be interpreted as, financial advice, an invitation, or an investment recommendation. Cryptocurrencies are highly volatile assets; only invest capital you are willing to lose.
Communications Professional. Crypto Enthusiast. Economic Journalist. Bitcoiner & Altcoiner.