

The market for sports and entertainment-oriented cryptocurrencies is once again flashing warning signs for investors. Chiliz (CHZ) suffered a severe technical setback after triggering a classic bull trap at the top of a minor reversal structure. Despite posting solid gains of 20.47% over the last 6 months and 14.72% in the recent quarter, the token cannot shake off vendor dominance. So far in 2026, the price registers a year-to-date loss of 12.99%, a figure that stretches to a 16.49% decline in the year-over-year balance. The inability to sustain advances within a primary downtrend forced an institutional liquidation that abruptly wiped out buyers’ efforts.
The Macro Context: The Harsh Reality of “Selling the Rally”
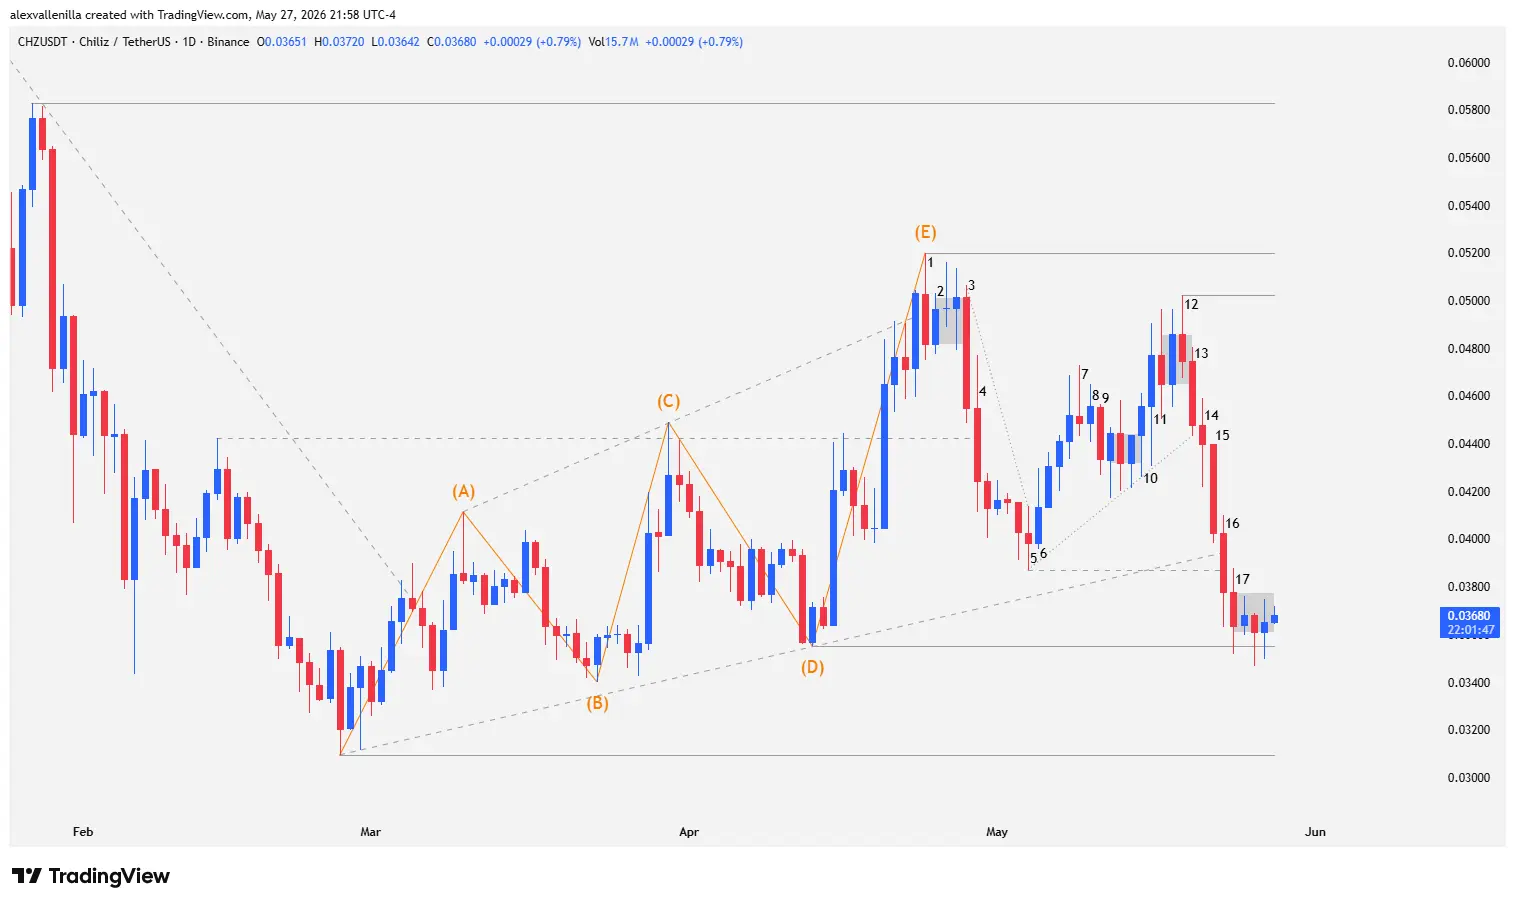
Recent CHZ price action demonstrates why counter-trend trades require precision discipline. Previously, the asset managed to break out of a 46-bar bearish microchannel, a move that analysts labeled a spike and channel pattern. This breakout generated initial optimism, driving a bullish ascending broadening wedge structure that completed three impulses and five structural pivots (identified from point A through E).
However, a primary bearish structure spanning 727 bars still conditions the big picture. In environments so markedly dominated by bears, smart money operates under the “sell the rally” premise, injecting sell liquidity into every major bounce. The failed attempt to test key resistance at $0.05828 confirmed that institutional money used the advance as a distribution zone, trapping retail traders who bought the wedge breakout.
Price Action Technical Analysis: Anatomy of the Collapse Bar by Bar
1. The Breakout Failure and Distribution Zone (Bars 1 to 2)
Bar 1: This bearish pullback bar established local resistance at $0.05199. It appears right at the peak of the broadening wedge’s third impulse. Although the previous candle teased a breakout above the pattern’s ceiling, Bar 1 closed with an upper wick measuring 30% of its total range. This signified a definitive failure of the bullish breakout, confirming the typical exhaustion seen in broadening patterns after three pushes. The price breached previous resistance at $0.04422 (the last relevant high of the prior microchannel), but only to trigger a trap.
Bar 2: A small bullish candle that acted as an inside bar. Its presence froze the price in tight congestion over the next two days, revealing an absolute loss of momentum from buyers and confirming distribution.
2. The Bearish Lash and Deception Confirmation (Bars 3 to 4)
Bar 3: Bears slammed the door with a massive, high-conviction sell candle, recording a 9.29% crash. This bar swept buy orders and validated the bull trap at the upper extreme. It formally initiated a 6-bar bearish microchannel.
Bar 4: A bearish follow-through candle that closed below the low of Bar 3. Its importance lies in the fact that it forcefully pierced support at $0.04422, dragging the price back into the technical gutter. Following this bar, the market chained together tight, low-volume downward movements.
3. False Hope for the Bulls (Bars 5 to 11)
Bar 5: A doji with a microscopic body and an extended upper wick whose low temporarily halted the bleeding, establishing structural support at $0.03870. Because it failed to test the 86-bar baseline uptrend line, the market maintained expectations for a bounce.
Bar 6: Buyers defended the zone by printing a higher low relative to the previous session, breaking the bearish microchannel born at Bar 3. However, an upper wick the size of its own body revealed that bears remained active. Subsequent sessions showed constant overlapping and very low-conviction bullish closes.
Bars 7 and 8: Bar 7 shaped up as a pinbar with a bearish close and a gigantic upper wick, followed by Bar 8, another small candle with an identical anatomy. Both confirmed rejection at the highs and institutional selling pressure, printing a lower high against Bars 1 and 3.
Bars 9 and 10: Bar 9 delivered a moderate pullback that maintained a higher low. Bar 10, a bullish pinbar with a large lower tail, broke the micro-congestion and gave breathing room to the developing 16-bar bullish channel.
Bar 11: Volatility returned to the chart with a wide-range bar that closed above the highs of Bars 7 and 10. With this move, bulls completed a two-leg upward structure from the Bar 5 low. However, the extremely long lower wick evidenced a fierce battle and a lack of conviction.
4. “Low 2” Short Setup and Capitulation (Bars 12 to 17)
Bar 12: A candle with a bearish close whose high barely touched $0.05023, locking in a new structural lower high. This bar marked the climax of the second leg up and the final exhaustion of demand after the long journey from Bar 5.
Bar 13: Sellers broke the slumber with a strong, wide-range bearish candle showing virtually no wicks (an implied marubozu), demonstrating absolute control of order flow and trapping Bar 11 buyers. Price tested the floor of the 16-bar channel.
Bar 14: A high-volatility bearish doji with extensive shadows on both ends. By closing below the low of Bar 13, it formally broke the 16-bar bullish channel. Technically, it triggered a high-probability Low 2 short setup, ideal for opening short positions due to Bar 12’s failure to test previous highs.
Bar 15: Selling pressure unleashed. This high-conviction, bearish momentum candle plunged 8.5%, triggering sell stops below the Bar 14 low. Its full body and absence of wicks left the unmistakable footprint of an institutional-driven capitulation.
Bar 16: The breakout trend destroyed structural support at $0.03870 (Bar 5 low) and pierced the 86-bar trendline. Although bears dominated, wicks on both ends began to show logical profit-taking.
Bar 17: This bar recorded a notable deceleration. With a reduced body and proportional shadows, it denoted low bearish conviction despite piercing historical support at $0.03551 (point D of the original wedge). Price entered a congestion area without formal closes below that level, suggesting the start of a temporary accumulation phase.
The Lesson from the CHZ Chart
Recent Chiliz price action reminds us of the importance of subordinating short-term moves to the higher time frame structure. The development of the broadening wedge and the subsequent Low 2 short setup at Bar 14 were textbook signals for price action analysts. While the CHZ sports ecosystem searches for new fundamental catalysts, the chart warns that bears remain in control, and any volume-less bounce will be treated as another distribution opportunity for institutional investors.
Disclaimer: This analysis is presented solely for informational and educational purposes based on Price Action methodology. It does not constitute financial advice, investment recommendations, or an offer to buy or sell digital assets. Cryptocurrencies exhibit high volatility; only risk capital you are willing to lose.

Communications Professional. Crypto Enthusiast. Economic Journalist. Bitcoiner & Altcoiner.


