

The digital asset market is witnessing a remarkable resurgence in one of the most controversial chains in its history. During the final stretches of this year, 2026, Terra Classic (LUNC) is capturing traders’ attention by posting a year-to-date cumulative return of 116.14% and a solid 46.97% appreciation over the past month. At the time of writing, LUNC leads the top 100 cryptocurrencies by market capitalization according to CoinMarketCap (CMC) data. This bullish move emerges immediately after a deep correction that threatened to invalidate the macro structure shift, but ultimately culminated in an institutional absorption of sell orders.
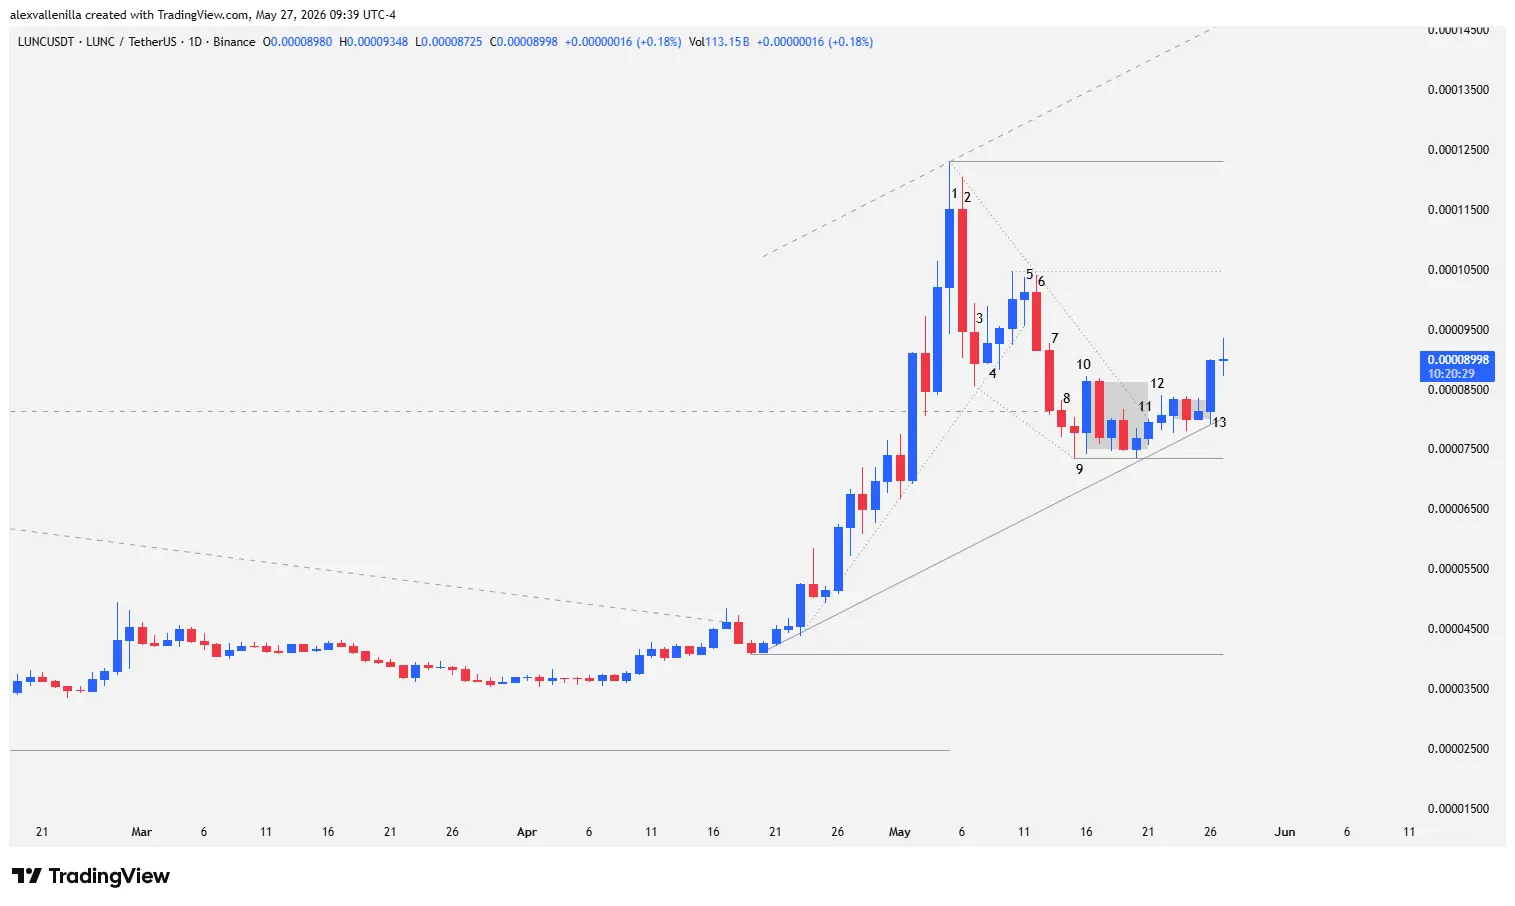
Chart Anatomy: The Battle for Structural Control
The technical context for LUNC on the daily (1D) timeframe outlines a highly relevant macro transition. Price managed to break above the upper boundary of a massive 865-bar falling wedge, which theoretically buries the prolonged downtrend to trigger a medium- and long-term bullish cycle.
However, financial markets rarely move in a straight line. Following the initial breakout, price developed an internal corrective structure within a primary ascending channel that has now accumulated 37 bars. The details of the price action over the last 13 sessions reveal how supply and demand negotiated control of the asset at critical support levels.
The Initial Impulse and Bearish Counteroffensive (Bars 1 to 3)
Bar 1: This session marked the culmination of the initial bullish impulse, printing a 12.72% expansion. Despite buyers dominating the close, prominent wicks on both ends evidenced a severe spike in volatility and inefficiency. The presence of the upper tail confirmed heavy rejection due to incoming supply, establishing key resistance at $0.00012300—a level that also anchored the projected top of the primary ascending channel.
Bar 2: The institutional supply response manifested as a sharp 17.70% bearish candle. Although this bar’s low pierced the previous session’s low, the close failed to establish below it, proving that bulls attempted to hold the price before being swept by selling volume.
Bar 3: Selling pressure continued with a smaller body, managing to close below the low of Bar 2. Nevertheless, bears failed to test the lower boundary of the 18-bar ascending micro-channel or the key technical support at $0.00008136 (the former lower-high of the previous downtrend). This lack of testing reflected a rapid exhaustion of selling pressure.
Bullish Weakness and Supply Capitulation (Bars 4 to 9)
Bars 4 and 5: Bar 4 acted as an inside pinbar candle with bullish intent, but its long upper wick betrayed persisting selling pressure. Subsequently, Bar 5 consolidated the price via a tiny-bodied doji. The lack of momentum in these bars, coupled with Bar 5’s inability to clear local resistance at $0.00010470, exposed a highly fragile reversal structure.
Bars 6 and 7: Bears capitalized on buying weakness to print Bar 6, a solid 9.53% bearish vector with a shaved bottom (no lower wick), demonstrating absolute control until the final second of the session. This candle formally broke the 18-bar ascending micro-channel and validated a lower high. Immediately after, Bar 7 deepened the drop by 11.03% with no overlap from the previous bar, directly testing structural support at $0.00008136 and sparking panic over a potential bull trap.
Bars 8 and 9: Bar 8 momentarily pierced support, but its shrinking body size suggested a loss of bearish momentum. This was confirmed in Bar 9, a pinbar candle with an extensive lower tail that demonstrated a massive absorption of sell orders by demand. The low of this session respected the macro structure, establishing a higher low and defining critical support at $0.00007347, while simultaneously completing a minor 16-bar falling wedge.
The Institutional Return and the End of the Correction (Bars 10 to 13)
Bar 10: Fueled by the prior deceleration pattern, this 10.93% bullish candle neutralized bearish pressure by closing above the highs of sessions 8 and 9. The subsequent three sessions entered a period of congestion and accumulation, keeping lows protected above the support of Bar 9.
Bars 11 and 12: Bar 11 broke the congestion with a higher close. Technically, this bar completed a corrective cycle of two bearish legs within the 16-bar micro-channel, marking the end of the deep corrective phase. Bar 12, despite its narrow range, consolidated the breakout from the minor falling wedge and validated the trendline of the 37-bar channel.
Bar 13: Institutional buyers took definitive control via a robust wide-range candle that expanded 10.36%. Its solid body, virtually devoid of tails, confirms strong buying conviction from start to finish, successfully clearing the highs of both previous congestion blocks.
Technical Analysis: Pure Price Action and Order Flow
From a pure Price Action perspective, LUNC’s behavior follows advanced trading textbooks. The initial breakout from the 865-bar wedge released an enormous amount of trapped energy, but Bar 1 generated excess volatility that required an order flow rebalance.
The decline spanning Bar 2 to Bar 9 should not be interpreted as the death of the bullish move, but rather as a healthy two-legged correction (a two-legged pullback pattern). The sellers’ loss of momentum became evident through the compression and deceleration pattern in the candle bodies of bars 7, 8, and 9.
Bar 13 now functions as an institutional confirmation candle. Lacking significant wicks, order flow shows a total imbalance in favor of buyers. Volume completely absorbed the floating liquidity at the bottom area of the primary 37-bar channel.
To definitively consolidate this structure, bulls must resolve two immediate objectives:
- Clear local resistance at $0.00010470.
- Test and break the high of Bar 1 at $0.00012300.
If demand maintains this pace, the technical projection based on a measured move equivalent to the size of the first bullish leg places the theoretical target at $0.00015000, coinciding with the upper band of the ascending channel. Otherwise, a failure at local resistances would force price to move sideways or seek support at the lower dynamic support zone located at $0.00008008.
The Order Book Verdict
The recent behavior of Terra Classic demonstrates that, beyond fundamental narratives, price action governs capital movements. The completion of the two-legged corrective structure and the subsequent institutional injection in Bar 13 validate the 37-bar ascending channel technically. If buying volume absorbs immediate resistances, LUNC will confirm that this was not a bull trap, but rather the establishment of a genuine structural floor for the medium term.
Disclaimer: The content of this article is presented solely for informative and educational purposes regarding technical analysis. It does not constitute, nor should it be interpreted as, financial advice, an invitation, or a recommendation to invest. Crypto assets exhibit extreme volatility; invest at your own risk and analysis.

Communications Professional. Crypto Enthusiast. Economic Journalist. Bitcoiner & Altcoiner.


