

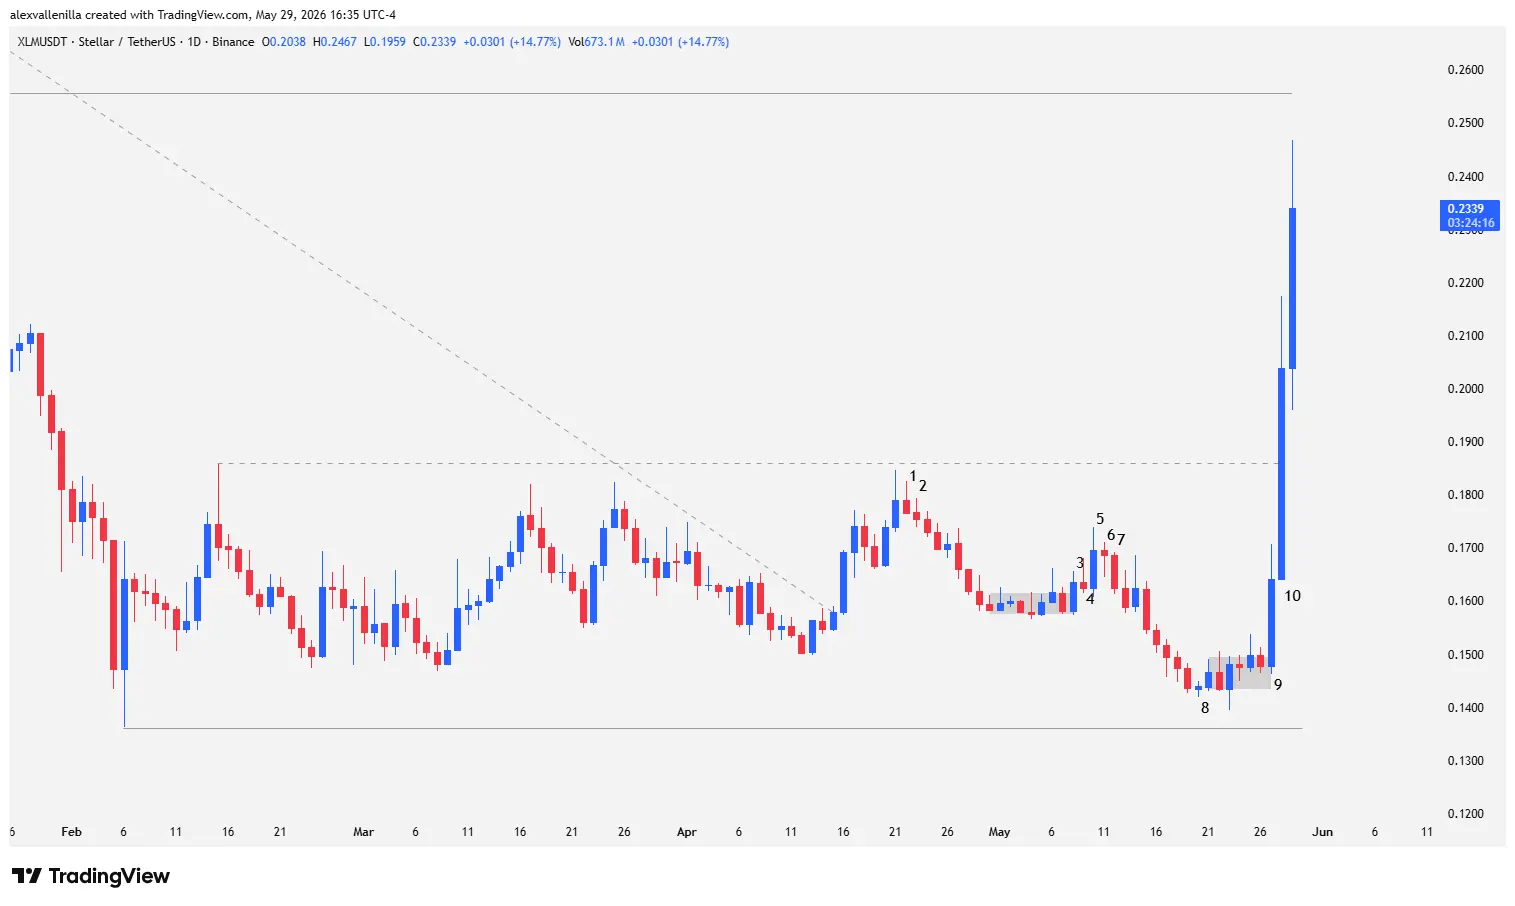
The digital finance market is witnessing a violent awakening on the Stellar (XLM) daily chart. Following a prolonged accumulation phase that kept the price trapped in a sideways channel, aggressive institutional capital inflows drove the price up 14.77% in the current session, pushing it to $0.2339. This move invalidates months of bearish dominance and tests supply resilience in key zones.
The Stellar Awakening: Institutions Absorb Supply
Stellar’s (XLM) lethargy is over. After breaking a major bearish trendline that dominated price action for 271 bars, the asset entered a transition phase under a “spike and channel” structure. This accumulation stage extended for 113 bars, establishing a very clear psychological and technical floor.
Buyers successfully defended critical support at $0.1361, a level that served as a buffer against bearish attempts to resume the macro downtrend. The prolonged sideways price action compressed volatility, setting the stage for the current vertical price expansion.
Technical Price Action Analysis
Order flow and market psychology reveal themselves clearly when breaking down the candlestick sequence on the daily (1D) timeframe:
Bar 1: A small bearish inside bar. It appeared after a two-legged upward move reacting to the breakout of the 271-session trendline. The price paused just before the $0.1861 resistance (the top of a 102-bar range), initiating the transition phase.
Bar 2: A narrow-bodied bearish candlestick that continued the pullback. It opened the way for an eight-session congestion in the exact middle of the range, showing a temporary balance between supply and demand.
Bar 3: An expanded-range bullish bar that broke the previous micro-congestion, signaling the first serious intent from buyers.
Bar 4: A bearish attempt to trap buyers (bull trap). However, it printed as a pin bar with a bearish close but a tiny body, resulting in a failed pullback.
Bar 5: A bullish outside bar that confirmed the bearish failure. Despite breaking above previous highs, the notable upper wick revealed that the $0.1861 resistance still contained massive sell orders.
Bars 6 and 7: Bar 6 (inside) demonstrated the buying side’s weakness in sustaining continuity. This allowed Bar 7 to start a pullback with greater conviction, extending into Bar 8. This sequence completed a symmetrical cycle of two bearish legs from Bar 1. The final leg exhibited overlapping and small bodies, denoting a lack of selling pressure.
Bar 8: A tiny doji that marked the total exhaustion of supply. By failing to test support at $0.1361, it confirmed bearish weakness. The subsequent candlestick broke the minor descending channel and generated a five-bar congestion pattern.
Bar 9: The breakout candlestick. A wide-range bullish bar delivering an 11.03% gain. It decisively broke the congestion, revealing institutional buying. The upper wick indicated intraday profit-taking.
Bar 10: An absolute momentum candlestick. A parabolic 24.19% move with a “shaved” base (no lower wick). Smart money bought right from the open, piercing the $0.1861 resistance and closing well above it. Volume and price action validated the range breakout with a measured move target equal to the width of the sideways channel.
The Current Crossroads: Key Resistance in Sight
At the time of writing, the daily bar trades at $0.2339, registering a 14.77% gain. The developing candlestick shows wicks on both ends, a sign that volatility remains at extreme levels after the Bar 10 breakout. Although bears are attempting to push down through profit-taking, bulls retain control of the order flow.
The price has not yet tested the macro target and key resistance at $0.2557, a level representing the last major lower high of the previous downtrend.
If the price fails to reach or consolidate above $0.2557, the risk of a severe correction increases exponentially. Vertical and parabolic moves are usually unsustainable over time; a rejection in this zone could translate into a major bull trap, forcing a pullback to test the old resistance at $0.1861, which now acts as flipped support. Conversely, a solid close above $0.2557 would restructure the long-term chart, officially decreeing the start of a new bullish cycle.
Stellar successfully completed the accumulation phase thanks to a massive injection of institutional capital. Price behavior around the $0.2557 zone will dictate whether we are facing a structural trend reversal or an overextended surge of optimism that will require a healthy technical correction.
Disclaimer: This analysis is presented for informational and educational purposes only. It does not constitute financial advice, an investment invitation, or a recommendation to trade digital assets. Cryptocurrency markets exhibit extreme volatility; trade at your own risk.

Communications Professional. Crypto Enthusiast. Economic Journalist. Bitcoiner & Altcoiner.


