

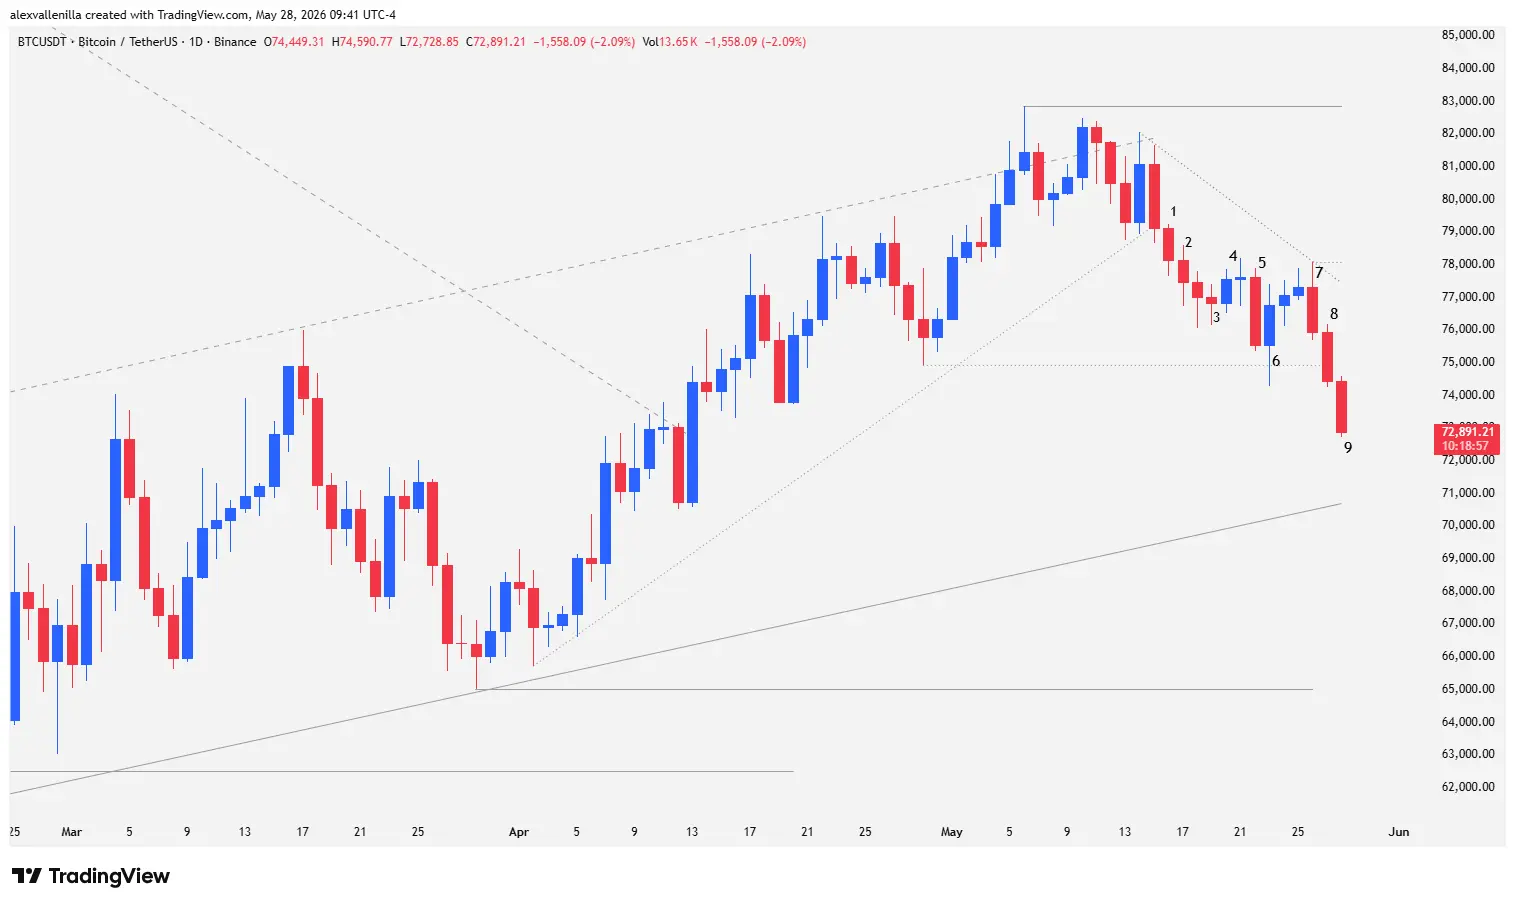
The cryptocurrency market is experiencing a highly precise technical bearish shakeout. Following a failed attempt to consolidate above $82,850, bitcoin (BTC) validated a bull trap that halted a 43-day daily bar rally. At the time of writing, the leading cryptocurrency trades at $72,891, posting a partial intradies loss of 2.09%. This move confirms the breakout of an ascending wedge and triggers a two-legged bearish structure in search of liquidity at dynamic support levels.
Rejection at $82,850 Activates the “Sell the Rally” Strategy
Bitcoin’s inability to break macro resistance at $82,850 with conviction shifted market optimism into institutional profit-taking. Even though buyers managed to break a previous 189-bar downtrend via a 111-bar ascending channel, selling pressure at the top of the channel prevailed.
This technical behavior reactivated the “sell the rally” strategy by whales and institutional traders, forcing a widespread pullback. So far, this looks like a healthy correction within the larger cycle, though with high short-term volatility.
Technical Analysis: Anatomy of Capitulation on the Daily Chart (1D)
Order flow and price action across the latest Japanese candlesticks reveal how bears took absolute control of the market, trapping traders who bought at the top of the structure.
Bar 1: This average-range bearish candle broke the lower boundary of a 43-bar ascending wedge formation. Sitting in the premium zone of a bullish channel, it functioned as a counter-trend Low 2 short setup. A strong bearish conviction candle preceded it, closing below the wedge trendline and confirming the reliability of the reversal pattern.
Bar 2: Bearish continuity candle. By breaking the low of Bar 1, it triggered massive sell stop-market orders, attracting higher supply volume. However, shrinking candle bodies and lower wicks indicated moderate absorption by demand.
Bar 3: A bearish closing doji that acted as an inside bar. Its extremely small body showed a clear deceleration pattern in the initial selling momentum.
Bar 4: Buyers’ reaction. Although they managed to close above the high of Bar 3 and disrupted the bearish micro-channel, the candle showed very low efficiency and zero conviction, exposing demand’s inability to take control. A subsequent indecision doji immediately confirmed this weakness.
Bar 5: Strong entry of supply. A high-quality bearish candle with extremely short wicks completely invalidated the previous reversal attempt. Despite its strength, the low of this bar failed to test local support at $74,900.
Bar 6: Substantial increase in volatility. Bears attempted to pierce $74,900, but bulls defended the zone by absorbing the sell flow, leaving a pronounced lower wick. Nonetheless, the price printed a lower high relative to Bar 5, keeping the counter-trend structure intact. The following two narrow-range candles with long wicks confirmed buyer exhaustion.
Bar 7: An engulfing bearish candle that overlapped the range of the previous two sessions, trapping lagging buyers. The high of this bar established local resistance at $78,100 and served as a pivot to plot a new 14-bar bearish channel.
Bar 8: An institutional liquidation candle of excellent technical quality. Sellers controlled the session from start to finish, accelerating the price with no overlap relative to Bar 7. This session consolidated the decisive breakout of the $74,900 support, triggering a minor capitulation phase.
Bar 9 (In Progress): The price trades at $72,891. The current candle accelerates the drop and increases the price range, a pattern characteristic of a climactic sell-order flush.
Market Projection: The “Spike and Channel” Pattern
Current price action charts a classic two-legged bearish correction. The acceleration observed over the last three sessions suggests the price is targeting the dynamic floor of the 111-bar ascending channel, located around the $70,700 zone. This level aligns symmetrically with the technical projection of the broken wedge’s base.
The macro scenario indicates that after the failed bullish breakout at $82,850, bitcoin will enter an accumulation phase under a Spike and Channel structure. This pattern will serve as a transition to wipe out market leverage before attempting a new bullish cycle.
Immediate Support: $70,700 (Dynamic channel base).
Key Structural Support: $65,000 (Main control point of the latest 43-bar rally).
Immediate Resistance: $74,900 (Former support that will now act as a polarity zone and order flow resistance).
The loss of $74,900 confirms that bears maintain control of short-term order flow. Bitcoin’s behavior around the $70,700 zone will determine whether the cryptocurrency stabilizes its price to trade sideways in a healthy accumulation range or extends the correction toward structural levels at $65,000. Yearly, the asset reflects a 32.96% decline over the last 12 months, cushioned by an 8.22% quarterly recovery.
Disclaimer: This analysis is presented for informational and educational purposes only. It does not constitute, nor should it be interpreted as, investment advice, financial counsel, or an invitation to trade digital assets. Cryptocurrency trading carries a high risk of capital loss.

Communications Professional. Crypto Enthusiast. Economic Journalist. Bitcoiner & Altcoiner.


