The cryptocurrency market is closely watching Kaspa’s (KAS) resilience. After an exhausting bearish dominance lasting over 600 days, the asset is beginning to flash technical signs of life suggesting a phase transition. The recent announcement from Keystone Hardware Wallet—confirming progress in address generation and cold storage support via the PSKT protocol in partnership with Kaspium—adds a layer of institutional security and self-custody that the ecosystem required to sustain long-term growth.
Trend Reversal: From Climax to Accumulation
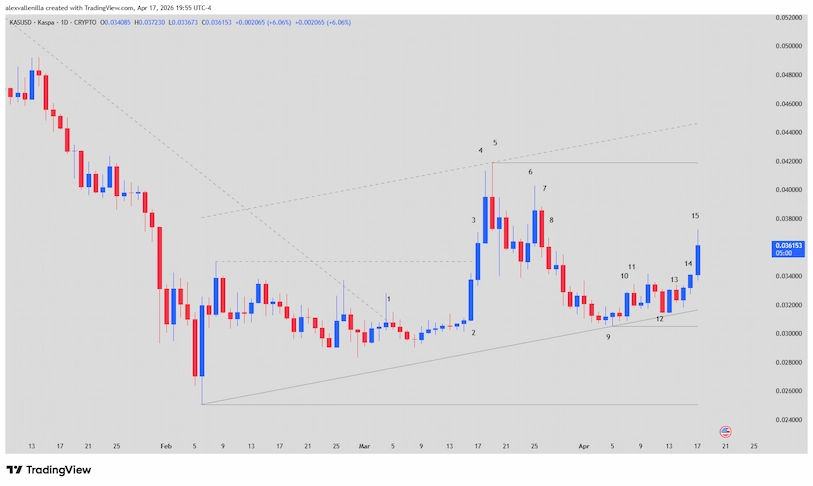
The KAS daily chart reveals a structural metamorphosis. Following a primary downtrend of 625 bars, price finally managed to pierce the secondary descending trendline (226 bars). This move was far from subtle: the market shifted from capitulation near $0.0250 to an expansion phase that we now define as a wide-range trading zone.
The current narrative suggests that KAS has stopped “bleeding” and has entered an accumulation zone or a higher-timeframe “Bull Flag.” However, the path upward is not linear, facing climatic rejections that have tested the bulls’ conviction.
Technical Analysis: The Bar-by-Bar Battle
To understand the immediate future of KAS, it is imperative to break down recent price action, where every candle tells a story of absorption and value transfer:
The Initial Impulse and the Climatic Trap (Bars 1-5)
Bars 2 and 3: Bar 2 acted as a Bull Surprise, firmly breaking through previous congestion. Bar 3 confirmed the momentum, closing above the $0.030 resistance.
Bar 4: This represented a climatic move of 8.83%. Although there was no overlap with Bar 3 (creating a measuring gap), the 25% upper wick warned that price had overextended from its moving average, attracting institutional profit-taking.
Bar 5: This was the reversal Signal Bar. By closing below 50% of Bar 4, it marked the local top at $0.0418, transforming optimism into a necessary pullback.
Sell Confirmation and the Bar 9 Floor
Bar 8: A textbook Low 2 setup (a second failed attempt to push higher). With a 4.25% range, it triggered sell orders that drove price toward lower liquidity.
Bar 9: An outside Doji that functioned as a Final Flag. Here, selling pressure exhausted, establishing critical support at $0.0305 and initiating the current bullish micro-channel.
Current Structure: The Micro-Channel (Bars 12-15)
Bar 12: Vital for the bullish thesis. By failing to touch the lower line of the 70-bar channel, it printed a Higher Low, signaling that buyers are willing to step in at higher levels.
Bar 15: At the time of this report, KAS closed at $0.0361 with a 6.13% gain. While it shows an upper wick suggesting limited selling near $0.0380, the lack of significant overlap with Bar 14 indicates buying urgency.
Projections and Key Levels
Order flow has migrated from dominant selling to gradual buying pressure. However, the absence of an explosive “Breakaway Gap” in the latest candles suggests we are in a tight, low-urgency channel.
Bullish Scenario (60%): If Bar 15 closes near its high, the natural target is a retest of the $0.0418 level (Magnet). A close above this level would open the door toward $0.0532.
Range Scenario (30%): A failure to overcome local resistance could return price to dynamic support at $0.0316, prolonging the sideways movement.
Risk Management: Invalidation of the current bullish bias lies below $0.0315 (the low of Bar 12).
An Asset in a Maturation Phase
Kaspa is transitioning from a pure speculation project to one with robust custody infrastructure. Technically, the market favors buyers, but caution remains necessary: true confirmation of a macro trend change will only come when the $0.0418 level stops acting as a ceiling and becomes a solid floor.
Disclaimer: This analysis is for informational and educational purposes only. It does not constitute financial advice. Crypto-asset investments carry high risk. Perform your own due diligence.
Communications Professional. Crypto Enthusiast. Economic Journalist. Bitcoiner & Altcoiner.