The ONDO token is currently staging one of the most intense battles in the crypto market on its daily (1D) chart. Following a violent bullish impulse that broke a prolonged bearish slumber, the price is slamming into a fundamental psychological and technical wall. Analysts and traders are closely watching the current price action, which debates the asset’s immediate future between the consolidation of a new macro cycle or an imminent rejection that would hand control back to the bears.
The Origin of the Conflict: From Accumulation to Key Resistance
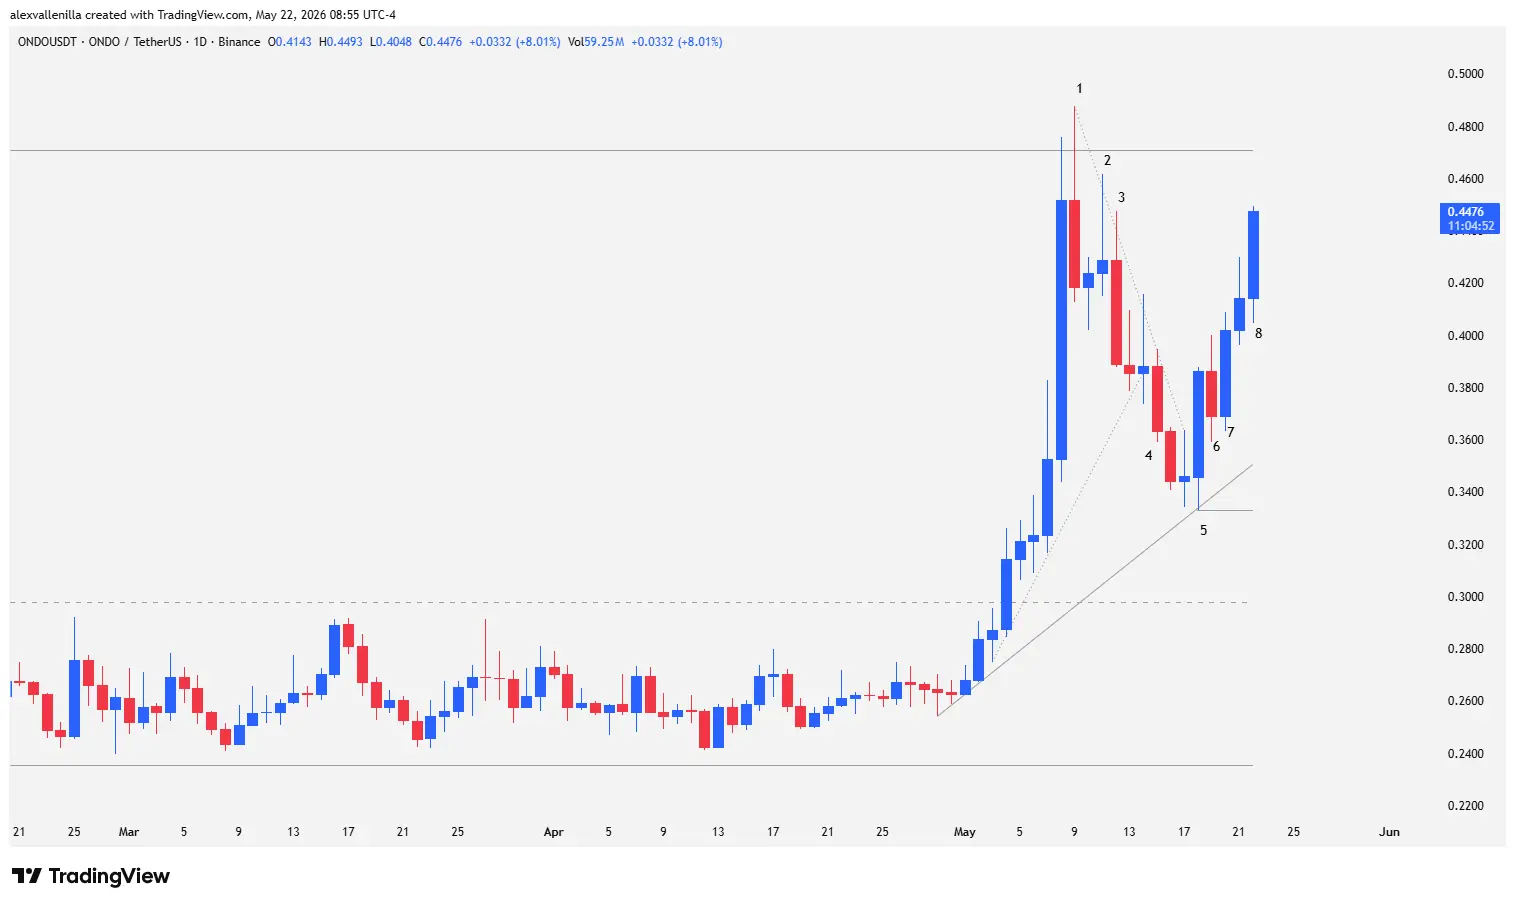
Markets do not move by chance; they move through transitions of power. ONDO recently completed a structural transition phase after breaking a prior prolonged downtrend that spanned 154 bars. This breakout led to a classic “spike and channel” pattern—the exact setup where accumulation algorithms operate prior to an expansive move.
Upon breaking out of that range, the price surged sharply and violently, catching the attention of momentum traders. However, the real challenge began when it reached the $0.4709 zone. This level represents the last major lower high of the previous bearish structure. Clearing it is not just a charting whim; it is the sine qua non requirement to officially declare the birth of a medium-to-long-term uptrend. As long as the price trades below it, any rally risks being interpreted by whales as a liquid selling opportunity.
Anatomy of the Bars: Chronicle of a Trap and the Subsequent Rescue
Technical Analysis (Highest Priority)
Bar 1 (Trap and Reversal): Following a prior buying climax, buyers found themselves exhausted. Bar 1 closed as a bearish reversal candlestick with a 7.37% drop. Although the long upper wick pierced the $0.4709 resistance, bears forced a close well below it, turning the move into a bull trap. Moderate selling pressure was confirmed in the following candle, which kept its high below resistance.
Bar 2 (Lack of Continuity): Bulls attempted to regain the initiative through a pin bar with a bullish close. However, the massive upper wick revealed profit-taking and position liquidation. The momentum failed, unable to even retest the prior resistance zone.
Bar 3 (Bearish Dominance): This solid 9.33% bearish candle buried the hopes of Bar 2. By printing a lower high, bears confirmed the start of a formal and deep corrective sequence.
Bar 4 (Microchannel Breakout): Selling pressure continued with a 6.46% decline. Prior to this bar, the market formed a wide-range doji (outside bar) that threatened to reverse, but Bar 4 invalidated the attempt, broke the previous bullish microchannel, and deepened the correction with another consecutive 5.20% candle showing no overlap. The subsequent appearance of a doji with a bullish close halted the inertia and introduced doubt into the supply.
Bar 5 (The Power Reversal): Demand responded with overwhelming force. Bar 5 exploded as a powerful outside bar with an 11.56% rally. Leaving virtually no upper wick, it trapped late sellers from Bar 4, broke the downtrend line of the pullback, and established solid dynamic support at $0.3332. This bar also served as the anchor to draw a new 23-bar uptrend line.
Bar 6 (Technical Pause): An inconsistent, narrow-range bearish bar with wicks on both ends, reflecting the bears’ failure to follow through on the previous decline.
Bar 7 (Momentum Confirmation): Buyers validated the failure of Bar 6 through a solid 8.89% bullish impulse. The close above the previous high trapped short-term sellers and propelled the current price action.
Bar 8 (Candle in Progress): At the time of writing, Bar 8 is advancing with a partial increase of 8.01%, trading at $0.4476. It shows clear bullish continuity, clearing the high of Bar 7 and decisively heading for a second retest of the macro resistance.
Projections: The Verdict of the Second Leg Up
The technical landscape presents two very clear mathematical scenarios for the upcoming sessions. The upward move originating from Bar 5 support carries the characteristics of a second bullish leg following the corrective resting phase.
If the current momentum maintains its velocity and manages a clean, consolidated breakout above the $0.4709 resistance, it will trigger a measured move target projection equivalent to the height of the prior base range, setting its sights on $0.7057. In the short term, the extension of this second leg projects intermediate levels around $0.5065.
Conversely, trading teaches that failed second attempts are usually catastrophic for the side that loses momentum. If buyers fail again at $0.4709, the market will structure a double top pattern. This technical rejection would trigger a sharp bearish reaction aimed at hunting liquidity at the dynamic support of the 23-bar trendline, currently sitting at $0.3505. However, bulls hold the upper hand given that the bullish momentum of the first leg was incredibly strong, while the pullback—though threatening—lacked the same force, showing lower-efficiency bars.
Financial Disclaimer: The content of this article is presented for informational and educational purposes only. It does not constitute, nor should it be interpreted as, investment advice, financial advice, or a recommendation to buy, sell, or hold any digital asset. Crypto assets exhibit high volatility and risk of capital loss. Every reader must conduct their own research (DYOR) before making financial decisions.
Communications Professional. Crypto Enthusiast. Economic Journalist. Bitcoiner & Altcoiner.