The Solana network kicked off 2026 by reaffirming its operational hegemony. According to recent reports from Blockworks, the chain captured an impressive 41% market share in spot trading volume during the first quarter, outperforming its direct competitors. Despite the volatility, institutional interest remains steadfast: SOL ETPs saw net inflows of $208 million, while its push into Real World Assets (RWA) already leads the sector with $1.23 billion in deposits. Nevertheless, on the chart, the battle remains quiet and technical; the asset is currently in a sideways transition phase that keeps investors on edge between $79 and $97.
Market Pulse: Between Historical Support and Institutional Resistance
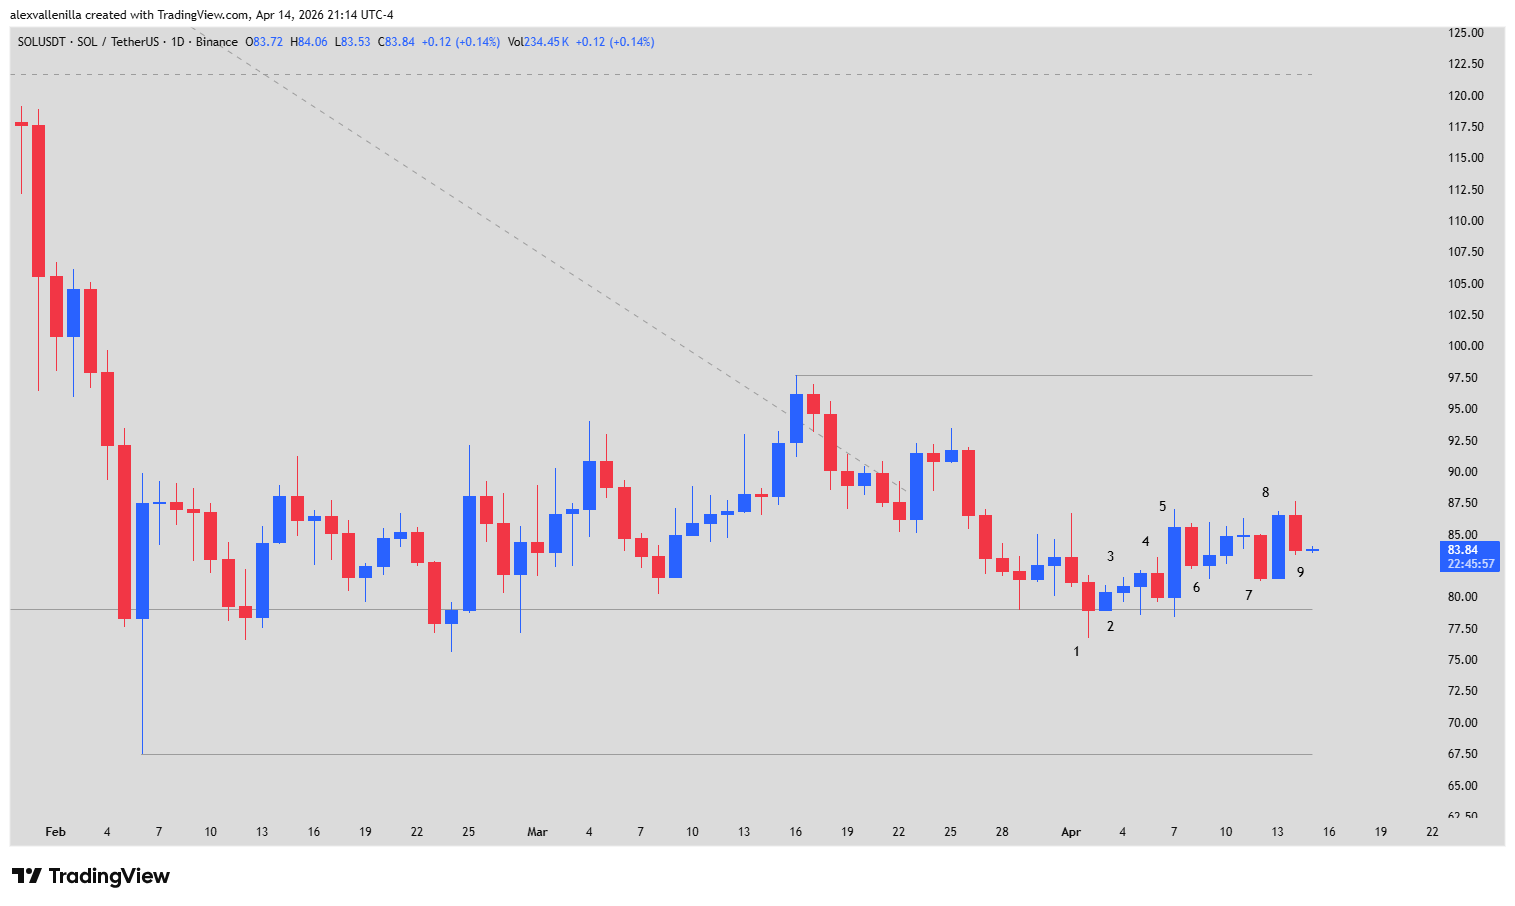
Solana is currently in a sideways trading range following a prolonged downtrend. What makes the analysis fascinating is that the $79.00 support isn’t just any number; it is a level that has served as a foundation for hundreds of bars, dating back to the very bedrock of its price action.
We are witnessing a Transition Phase. After breaking the previously marked descending trendline, price shifted from a vertical drop to a lateralization that denotes accumulation. The network is more efficient than ever, hitting peaks of 1,300 TPS (transactions per second), but the price awaits a spark of liquidity to validate its fundamental value.
Technical Analysis: Bar-by-Bar Narrative
To understand the immediate future, we must “read” participant psychology through recent price action:
Bar 1 (Breakout Failure): Bears attempted to pierce $79, but the long lower tail confirms a “liquidity sweep.” Buyers absorbed all available supply.
Bars 2 and 3 (Pullback): Technical retracements following the B1 failure. B3 showed a weak buy signal, but it was enough to stop the bleeding.
Bar 4 (Higher Low Test): A key move. Price failed to touch $79, indicating that buyers are stepping in “higher up,” anxious not to be left behind.
Bar 5 (Bull Surprise): A solid bullish trend bar that broke through micro-resistance. This marked the first major display of strength.
Bar 6 (Inside Bar): The market took a breather. This pause created an overlap that confirms momentary equilibrium.
Bar 7 (Second Attempt Failure): Bears tried to regain control a second time and failed. In trading, when one side fails twice, a violent move in the opposite direction usually follows.
Bar 8 (Bullish Momentum): A large green candle driven by the B7 failure. However, it failed to close above the B5 high, leaving local resistance active.
Bar 9 (Bear Surprise): A disappointment for the bulls. By closing below 50% of the B8 body, it negates immediate momentum and suggests price needs to retest the mid-range zone ($81.50 – $83).
The quality of the upside move (clean bodies in B5 and B8) is superior to that of the corrections. This suggests that “strong hands” are accumulating at the lower end of Solana’s price history.
Projections: Where is SOL Heading?
Price is currently trapped in a Congestion Apex. The most likely short-term scenario is continued range-bound trading between $79 and $90.
Bullish Scenario: If SOL consolidates above $88.00 and breaks the $97.68 resistance, the technical “Measured Move” target sits at $121.00—a level that functioned as vital support before the last crash.
Bearish Scenario: If $79.00 support is lost on high volume, the asset would likely seek $67.50, invalidating the current accumulation thesis.
Solana is demonstrating enviable operational resilience, leading in RWA and network efficiency. Technically, the chart is “shaking out” weak hands before a potential major structural shift back toward triple digits.
Disclaimer: This analysis is for informational purposes only and does not constitute financial advice. Crypto asset investments carry a high level of risk.
Communications Professional. Crypto Enthusiast. Economic Journalist. Bitcoiner & Altcoiner.