

JST’s price action is undergoing extreme technical compression, signaling an imminent volatility breakout. After posting an impressive 159.39% return over the past 12 months and a solid 124% gain year-to-date in 2026, the asset remains trapped within a 102-bar ascending wedge structure. This formation is compressing higher lows directly against the ceiling of a larger, 1,145-bar ascending channel. The market is currently debating whether buyers retain enough order flow to pierce the dynamic resistance at $0.09847, or if institutional players will trigger massive profit-taking, forcing a deep pullback toward structural support levels.
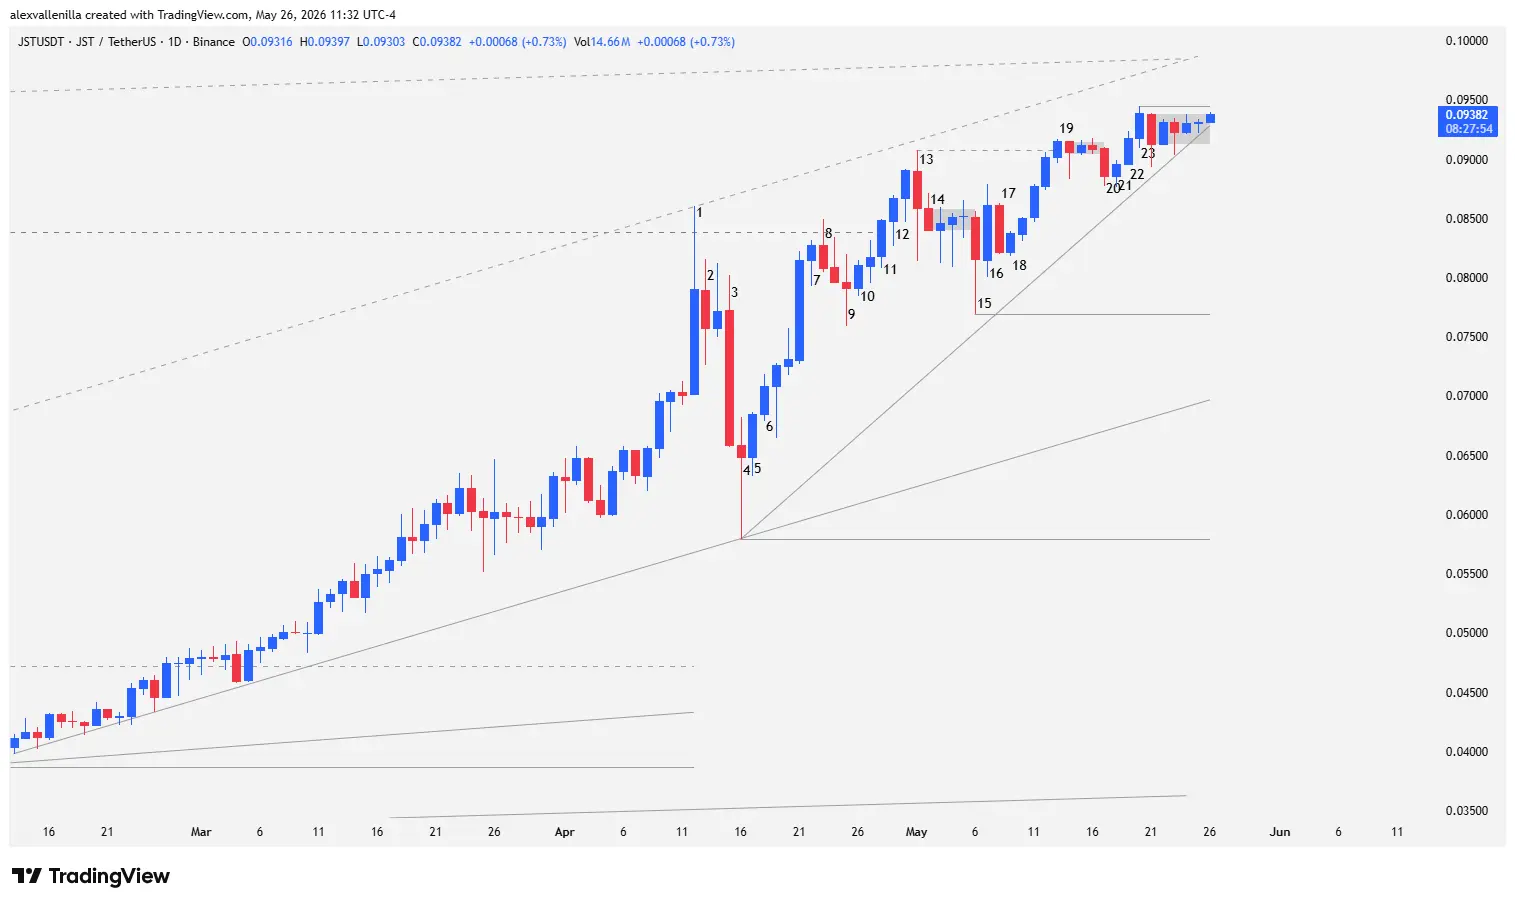
The Battle for $0.08389: Anatomy of an Absorption
Recent price behavior exposes a fierce liquidity transfer between retail traders and whales, characterized by bull traps and persistent supply absorption at support zones.
Volatility Awakening and Institutional Rejection (Bars 1 to 3)
The move began with Bar 1, an aggressive 12.77% bullish impulse that injected volatility into the market and successfully pierced $0.08389—a historical resistance level that had gone untested for 510 bars. However, bears aggressively defended the zone, leaving a prominent upper tail and forcing a close below this key level. The lack of a bottom wick (shaved bottom) confirmed the buyers’ initial conviction, but the failed breakout immediately attracted the counterparty.
Bar 2 acted as a bearish inside bar, confirming the pause, which led to Bar 3: a solid, efficient bearish candlestick that plunged 14.74%. With a completely shaved bottom, this bar showed that institutional players continuously liquidated positions until the final second, breaking even the low of Bar 1 and flashing warning signs of a larger correction.
Structural Floor and Bullish Climax (Bars 4 to 7)
Demand responded without delay. Bar 4 printed a pin bar with a massive lower tail, an unmistakable sign that buyers quickly absorbed the excess supply. This low established a key structural support at $0.05790 and served as the lower anchor for the 102-bar micro ascending channel.
Buying pressure found validation in Bar 5 (+5.55%), a candlestick with higher highs and higher lows that neutralized the bearish bias. Follow-through arrived with Bar 6, an imposing bullish outside bar that broke the previous micro-descending channel and triggered a dramatic climax toward $0.08389. However, as an abrupt acceleration following four bars of deceleration, it operated as a terminal buying climax. This resulted in immediate exhaustion on Bar 7, a small candlestick unable to test the resistance.
Barbed Wire Compression and Buy Setup
Following the climax, the market entered a distribution and subsequent re-accumulation phase, visible in the narrowing of trading ranges.
False Breakouts and the Triumph of Higher Lows (Bars 8 to 15)
Bar 8 attempted to subtly pierce the resistance but closed lower, showing selling activity. Despite this, the pullback was weak as it stayed within the range of the previous bar. After an indecision doji on Bar 9 and an inside bar on Bar 10, buyers regained control on Bar 11. Boasting an efficient body and almost no upper wick, it achieved the highly anticipated close above $0.08389, a move confirmed by Bar 12.
The rally temporarily topped out at Bar 13, a bearish outside bar that completed a perfect two-legged bullish cycle from the Bar 4 low, establishing new resistance at $0.09077. Despite the bearish close, its long lower tail proved that bulls continued to absorb supply at elevated prices. Following inaction on Bar 14, price congested into a “barbed wire” structure, temporarily broken by Bar 15. The latter attempted to deepen the drop but closed with a lower wick that successfully defended the previous lows, keeping the bullish structure intact and shaping the ascending wedge.
Tweezer Bottoms and the Path to the Technical Target (Bars 16 to 23)
Bar 16 (+5.67%) trapped lagging bears from the previous session. Although Bar 17 retraced -4.61% as an inside bar, the lack of follow-through on Bar 18 generated a tweezer bottom pattern at the lows, triggering a clear buy setup. This fueled a five-bar tight channel that culminated in Bar 19, breaking the high of Bar 13.
Macro Projections: Breakout or Capitulation Scenarios
Technical analysis highlights that JST is moving within an ascending wedge, a pattern that statistically tends to resolve to the downside due to a gradual loss of momentum (a loss of quality visible since Bar 7). However, because it sits within a larger ascending channel, the resolution will depend critically on the following geometric levels:
If buy orders manage to absorb the current dynamic resistance at $0.09847, JST will head toward $0.11748—a level left untouched by the market for more than 1,500 bars—which would trigger a parabolic rally. Conversely, if institutional supply breaks below the wedge’s dynamic support at $0.09281, traders will look for liquidity at $0.07690 or at the base of the micro-channel at $0.06967, which are ideal zones to evaluate new long entries using price action methodology.
Disclaimer: This technical analysis is based exclusively on price action and the historical data provided. It does not constitute financial advice or investment recommendations. Cryptocurrencies represent highly volatile assets.

Communications Professional. Crypto Enthusiast. Economic Journalist. Bitcoiner & Altcoiner.


