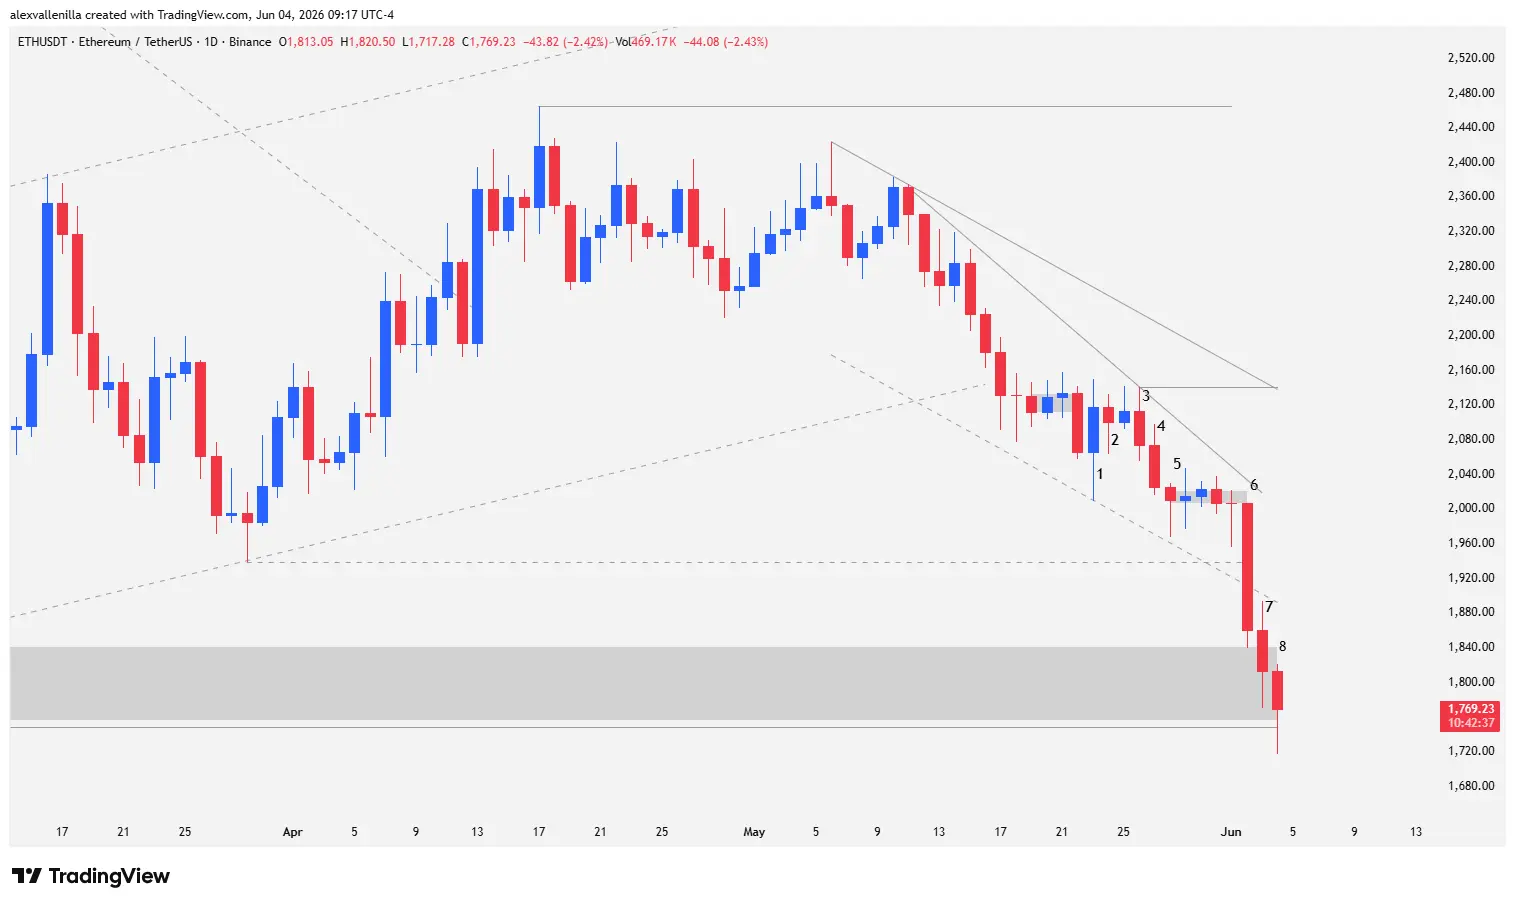
The crypto market faces decisive hours. Ethereum (ETH) is currently trading at $1,769, posting a partial loss of 2.42% in today’s daily session (Bar 8). Following the collapse of an ascending channel that spanned 81 bars, bears took absolute control of order flow. The loss of key structural support at $1,940, validated by massive institutional capitulation, pushed the price to test critical support at $1,750—a level that remained unbroken for 118 bars. So far in 2026, the asset has accumulated a 40.78% pullback, wiping out all the optimism built since February 6 in one fell swoop.
The Origin of the Crash: Anatomy of a Bull Trap
Ethereum‘s macro structure suffered a severe technical setback. The price had previously broken out of a 188-bar downtrend, a move the investment community interpreted as the start of a new long-term accumulation phase. However, the subsequent 81-bar ascending channel failed to consolidate higher highs above macro resistance at $2,460.
This structural failure turned into a bull trap. As the bottom of the channel gave way, a new secondary downtrend triggered, which has already developed over 29 bars. The speed of the drop accelerated through price compression, trapping leveraged traders who were looking to buy intermediate supports.
Technical Analysis: Bar-by-Bar Price Action
The ETH/USD daily chart reveals an impeccable psychological narrative across its last eight sessions, where institutional order flow dictated the market’s pace.
Bar 1: An outer bullish bar. Volatility expanded following the breakout of a previous congestion pattern. Although bulls attempted to defend the structure, this move only served to sweep liquidity before continuing downward after the formal breakdown of the 81-bar ascending channel.
Bar 2: An inside bar consolidation. The market took a temporary breather, showing a short-term balance of power before the next expansion.
Bar 3: Bears renewed the pressure. The high of this bar became a key pivot or anchor point to plot an accelerating downtrend line. By printing a lower high relative to the previous structure, this secondary line validated the strength of the main 29-bar downtrend. Furthermore, the interaction of this line with the lower band of the channel formed a descending wedge, compressing highs downward and turning the high of Bar 3 into local resistance and the point of control for the pattern.
Bar 4: Explicit bearish continuation. The price closed below the low of Bar 3, setting up a high-probability Low 2 short entry pattern (the second consecutive lower low).
Bar 5: This bar tested the bottom of the descending wedge. Its pinbar structure (a candle with a long lower wick) revealed demand absorbing supply, as buyers tried to halt the drop ahead of the $1,940 support. Following this session, the price entered a tight congestion pattern (barbwire) over the next four days. However, Bar 5 left a latent sell order, triggering the signal from Bar 4 after breaking below its low.
Bar 6: The panic session and institutional exit. A massive bearish bar printing a 7.32% contraction. Its conviction was absolute: it lacked an upper wick or shadow, proving that smart money sold heavily from the opening second of the session and maintained pressure into the close, leaving a tiny lower wick. This climatic capitulation candle violently broke key support at $1,940 and the bottom of the wedge, hunting for liquidity in an old congestion zone.
Bar 7: Continuation of Bar 6’s momentum with a close below its low. However, it showed less conviction, developing a pronounced lower tail. The price dipped into the historical support area that prevented deeper drops below $1,750 for the past 118 bars, though the low did not touch that exact level during this session.
Bar 8 (Current Bar): At the time of writing, ETH trades at $1,769. The daily candle temporarily pierced structural support at $1,750, but order flow shows absorption, and the price currently trades slightly above the critical level, recording a partial loss of 2.42%.
Climatic Phase or the Gates of Crypto Hell?
Despite the severity of the pullback, a detailed analysis of price action leaves a window of hope open for bulls. Aside from Bar 6, the rest of the bearish sessions do not show volume or price ranges with dominant institutional drive. The lower tails on Bar 7 and Bar 8 suggest that Ethereum might be ending a climatic move or capitulation phase, which are common traits when bearish momentum exhausts itself.
To consolidate a bounce, the market needs a buying volume catalyst to step in. Otherwise, if the $1,750 support gives way on a daily close and the price stabilizes below it, Ethereum will open the door to a severe corrective scenario. The next technical target sits at $1,540; reaching that level would confirm the absolute failure of the annual structure. If the bleeding continues, losing successive supports at $1,390 would expose the asset to a liquidity hunt in the psychological zone between $1,000 and $900.
The medium-term metrics are stark: with this move, Ethereum’s losses extend to 32.14% over the last 12 months and 15.10% for the quarter, wiping out all the value accumulated by buyers in the first half of the year.
The resilience of $1,750 will define Ethereum’s technical outlook for the rest of 2026. The visible absorption in the current bar will determine whether the market undergoes a capitulation reversal or, conversely, begins a macro capitulation phase toward cycle lows.
Disclaimer: The information contained in this article is purely informative, educational, and analytical, and must not be considered under any circumstances as financial advice or an invitation to invest. Cryptocurrencies represent highly volatile and risky assets.
Communications Professional. Crypto Enthusiast. Economic Journalist. Bitcoiner & Altcoiner.