The digital finance ecosystem is witnessing a technical metamorphosis in the BEAT/1D pair. Following a prolonged period of quiet accumulation by smart money, Audiera’s native token breaks structural molds through a parabolic acceleration. Bulls assume definitive control of the order flow in a vertical move that crushes historic resistances and projects ambitious targets toward $3.09, consolidating a stellar performance of 430.05% over the past year.
Anatomy of a Breakout: The Awakening of Audiera
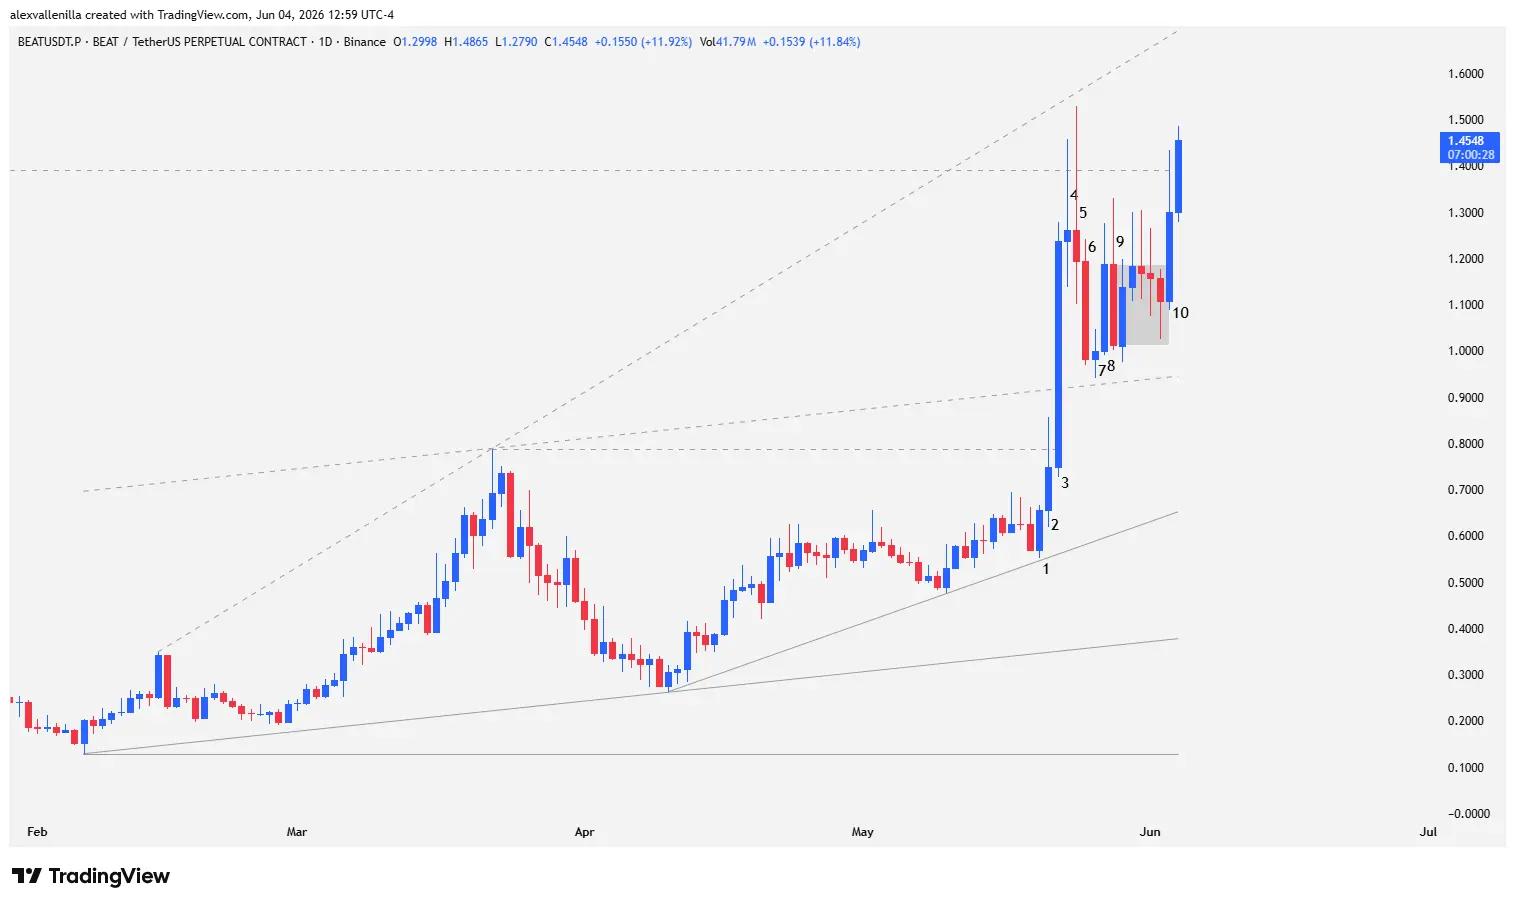
The crypto market does not move by chance, but by the indelible footprint that smart money leaves on the chart. During 2026, the BEAT token absorbed a slight contraction of -1.08% that served as the ideal setup for a massive absorption of supply. This technical accumulation phase just erupted on the daily chart (1D) with an impressive monthly return of 158.87%. At the time of writing, bitcoin’s price firmly pierces the $1.45 barrier, registering an intraday gain of over 11%.
The key to this move lies in the transmutation of its price structure. The base of the main ascending channel, meticulously built over 118 bars, began to expand. This geometric anomaly gave way to an ascending widening wedge, a high-volatility configuration where price breaks traditional guidelines to seek value discovery in areas unexplored for months.
Price Action Radiography: Bar-by-Bar Analysis
To understand crowd psychology and the institutional algorithm, we must break down the recent candlestick sequence:
Bar 1: Buyers print a wide-range bullish candle with a 15.36% advance. The session low millimetrically respects the accelerating ascending trendline (55-bar), validating a higher low. By configuring as an outside bar, it invalidates the previous pullback and triggers algorithmic buy stops.
Bar 2: Extreme volatility unleashes. The bar high temporarily pierces key resistance at $0.7876, a structural level defining the ceiling of the original 118-bar channel and projecting the widening wedge. Although bulls fail to sustain the close above, they manage to close the session very close to the limit, confirming the continuity of the buying order flow from Bar 1.
Bar 3: An absolute explosion of institutional conviction. The bar shifts vertically by 64.93%, with a giant body covering nearly 100% of its range. This dramatic climax candle authoritatively breaks the $0.7876 resistance and the channel ceiling, confirming the parabolic acceleration. As a markedly vertical impulse, the market assumes the risk of temporary exhaustion.
Bar 4: The expected pause manifests through a wide-range Doji with a tiny body. Price tests the historic resistance zone of $1.438 (a critical former support from past cycles), but bulls fail to consolidate a close above.
Bar 5: Outside bar configuration, Pinbar type. It features a massive upper tail confirming profit-taking and the entry of aggressive sellers. The high stops very close to the upper boundary of the widening wedge. Technically, it represents the third impulse of the macro expanding structure, signaling the climax and transient exhaustion of the buying block.
Bar 6: High-conviction bearish candle validating the previous rejection. Smart money presses lower, though volume does not exceed the milestone of Bar 3. The low respects the former ceiling of the ascending channel, converting previous resistance into dynamic support.
Bar 7: A millimetric Doji with a bullish close neutralizes selling pressure. The loss of bearish momentum opens the door for an immediate reversal.
Bar 8: Institutional capital reactivates the engine. This impulse bar lacks a lower wick, demonstrating absolute buyer dominance from the open. It clears the high of Bar 6 and invalidates the previous bearish bias, despite a slight upper shadow caused by residual selling.
Bar 9: Volatility persists, and bears manage to print a high wick. From here, price dives into a five-bar congestion without a clear direction, but with a crucial nuance: the range holds above the ascending channel ceiling, which acts as dynamic support at $0.9453.
Bar 10: Buyers break the congestion structure. However, the session closes leaving an upper wick equivalent to 30% of the candle’s total range. Price momentarily pierces resistance at $1.3915 without achieving a definitive close, establishing a strategic breather before the final assault.
Structural Outlook: The Path Toward $3.09
The macroeconomic and technical landscape heavily favors trend continuity. The horizontal resistance at $1.3915 holds extreme mathematical relevance: it had not been tested in the last 160 bars and represents the breakdown line of an old structural market support.
The fact that the pullback after the Bar 3 climax resolved with just one solid candle of bearish conviction (Bar 6), before being completely absorbed by the market, confirms the resilience of the trend.
The definitive clearing of this liquidity node, validated by the current price above $1.45, clears the technical horizon. If the session confirms its daily close at these levels, the BEAT/1D pair will nullify the gravitational pull of the wedge and trigger a direct technical projection toward the next macro resistance, located at $3.09.
Otherwise, if bulls fail, any pullback must take into account the dynamic support at $0.9453.
The recent behavior of BEAT is a textbook study on price action: the successful transition from a mature 118-bar channel to an expansion structure proves that institutional appetite remains intact. The $1.3915 resistance stopped being a ceiling to become Audiera’s launchpad in this 2026.
Disclaimer: This analysis is strictly for educational and informational purposes and does not constitute financial advice, investment recommendations, or offers to buy or sell digital assets. Crypto assets exhibit high volatility; invest at your own risk and market analysis.
Communications Professional. Crypto Enthusiast. Economic Journalist. Bitcoiner & Altcoiner.