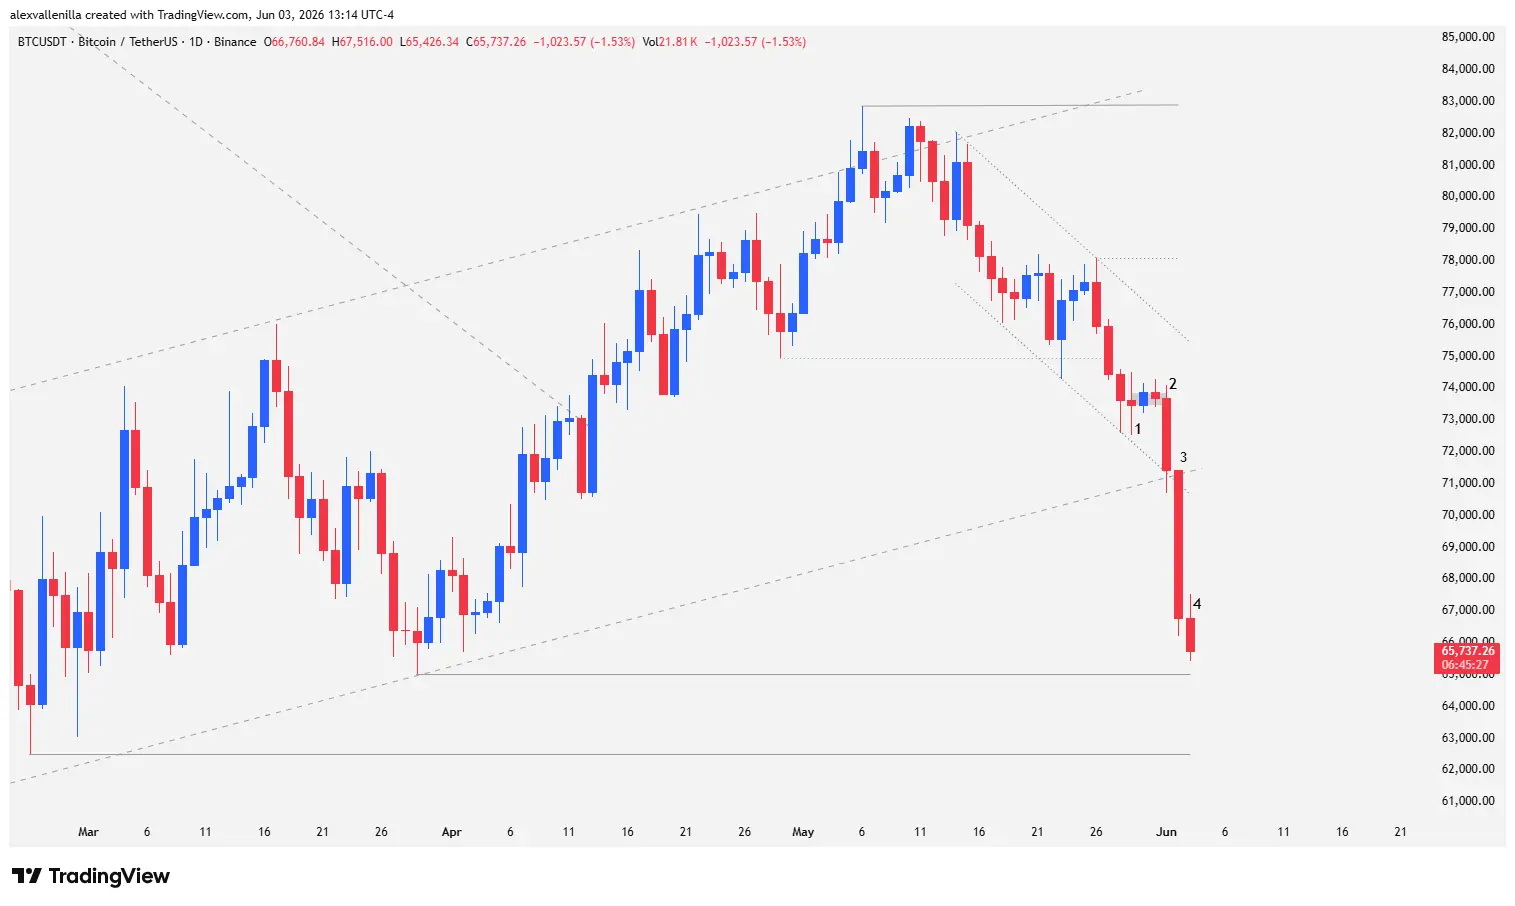
The cryptocurrency market is experiencing a systemic shake-up. In recent sessions, bitcoin (BTC) posted an aggressive, deep correction that culminated in a bearish capitulation, breaking below a 118-bar ascending channel on the daily (1D) chart. The move, driven by panic and institutional sell-order flow, accelerated drastically after confirming a bull trap around the $82,850 resistance zone. Currently, the leading cryptocurrency struggles to stabilize at $65,737, using the $65,000 structural support as its last line of defense before compromising its macro trend structure.
The Origin of the Crash: The $76,000 Failure
The recent price bleeding is no technical accident. The origin of the current move traces back to the double rejection at the $82,850 all-time high. Bitcoin was coming off a breakout from a 189-bar macro downtrend and attempting to consolidate above the psychological and technical zone of $76,000.
However, buyers (bulls) lacked the volume and order flow necessary to sustain that level. When absorbing supply failed at the highs, the market generated a bull trap that reversed the immediate bias, triggering a two-legged correction that trapped overleveraged traders.
Anatomy of the Price Action: 1D Candlestick Analysis
To understand market psychology and actual order flow, it is essential to break down the last four sessions of the daily chart, which reveal the transition from exhaustion to mass capitulation:
Bar 1: The Calm Before the Storm (Deceleration Doji)
Bar 1 printed as an extremely small-bodied doji. Technically, this bar appeared near the end of the second leg down, just as the price tested the lower boundary of the 118-bar ascending channel. The chart set up a brief three-bar congestion zone, also closing as an inside bar. At this point, Bar 1 simultaneously validated the lower limit of a 20-bar countertrend microchannel. The market showed a temporary balance and signs of apparent seller exhaustion.
Bar 2: Smart Money Steps In and Volatility Spikes
The balance broke with Bar 2, a wide-range candlestick that expanded volatility with a 3.08% drop. During this session, algorithms and institutions (smart money) took control of the order flow. Although the session low momentarily pierced the lower trendline of the 118-bar channel, latent demand prevented a close below the structure. It was classified as an acceleration bar confirming the strength of the bearish microchannel against dynamic support.
Bar 3: Climatic Capitulation and Structural Breakout
Bar 3 represented the violence of retail panic and mass stop-loss execution. Bears took absolute control right from the open, printing a monumental 6.51% bearish candle featuring a shaved top (a marubozu with no upper wick). This demonstrates absolute selling conviction from the very first second of the session.
The candle forcefully broke the 118-bar ascending channel, confirming the validity of the bull trap set weeks prior at $76,000. As the largest bar across the entire 20-bar microchannel, it qualifies as a climatic acceleration candle. Sell-order flow absorbed all available liquidity right through to the close. Nonetheless, the session low respected key support at $65,000, the first structural point of control for the previous uptrend.
Bar 4: Sharp Deceleration at Support (Current Session)
Bar 4, tracking the development of the current session, trades at $65,737 with a marginal decline of 1.53%. Following the climatic effort of the previous session, the price shows a sharp deceleration. Bears temporarily exhausted their ammunition (selling off everything they could due to FUD), and the current candle remains contained above the critical $65,000 pivot.
Technical Scenarios: Imminent Bounce or a Trip to $60,000?
Despite the spectacular nature of the crash, bitcoin keeps its long-term macro structure intact, which spans a 1,252-bar cycle. The climatic nature of Bar 3 suggests that the downward move might be exhausted, which typically attracts value buyers ahead of a technical bounce or reversal.
Bullish Scenario (Technical Bounce): If the price manages to consolidate above $65,000, the natural target for a bounce is the dynamic resistance of the broken ascending channel—a technical polarity zone currently converging at $71,500.
Bearish Scenario (Continued Panic): If supply keeps pressing and the $65,000 support gives way, the next static support level sits at $62,500. The ultimate line in the sand for the macro structure is $60,000; losing this final level would invalidate the long-term cycle, opening the door to a prolonged bearish phase.
The massive bitcoin sell-off proves that pure price action and order flow dictate the rhythm of the market long before traditional indicators react. Holding the $65,000 structural support will determine whether this drop was a simple shakeout of weak hands to pool liquidity, or the prelude to a more severe local crypto winter.
Disclaimer: The technical analysis and information provided in this article are strictly for educational and informational purposes and do not constitute investment advice or invitations to trade in financial markets. Cryptocurrency trading carries a high risk of capital loss.
Communications Professional. Crypto Enthusiast. Economic Journalist. Bitcoiner & Altcoiner.