The crypto market is witnessing a crucial battle in the price action of the IMX (Immutable) token. After registering a prolonged downtrend on its daily chart (1D), the cryptocurrency is showing signs of institutional accumulation through a “spike and channel” pattern. Despite dragging severe losses of 72.08% over the past year and a 29.36% pullback so far in 2026, price stabilization in the last quarter—where losses slashed drastically to a marginal 2.52%—confirms that high-volume buyers are attempting to build a definitive floor at the key support zone of $0.1290.
The Macroeconomic Context of Immutable: Transition and Relief
The IMX ecosystem is transitioning through a phase of technical maturation and market restructuring. The accumulated drops over the past twelve months reflect the hangover of a macro bear cycle; however, price behavior over the last three months evidences a drastic deceleration of selling pressure.
This reduction in bearish bias coincides with a systematic absorption of supply at historically low levels. The transition from a linear downtrend to a sideways structure suggests that institutional capital has begun to identify value in the asset, executing limit buy orders without drastically altering the order book to prevent abrupt price spikes.
Exclusive Technical Analysis: A Deep Dive into Price Action (1D)
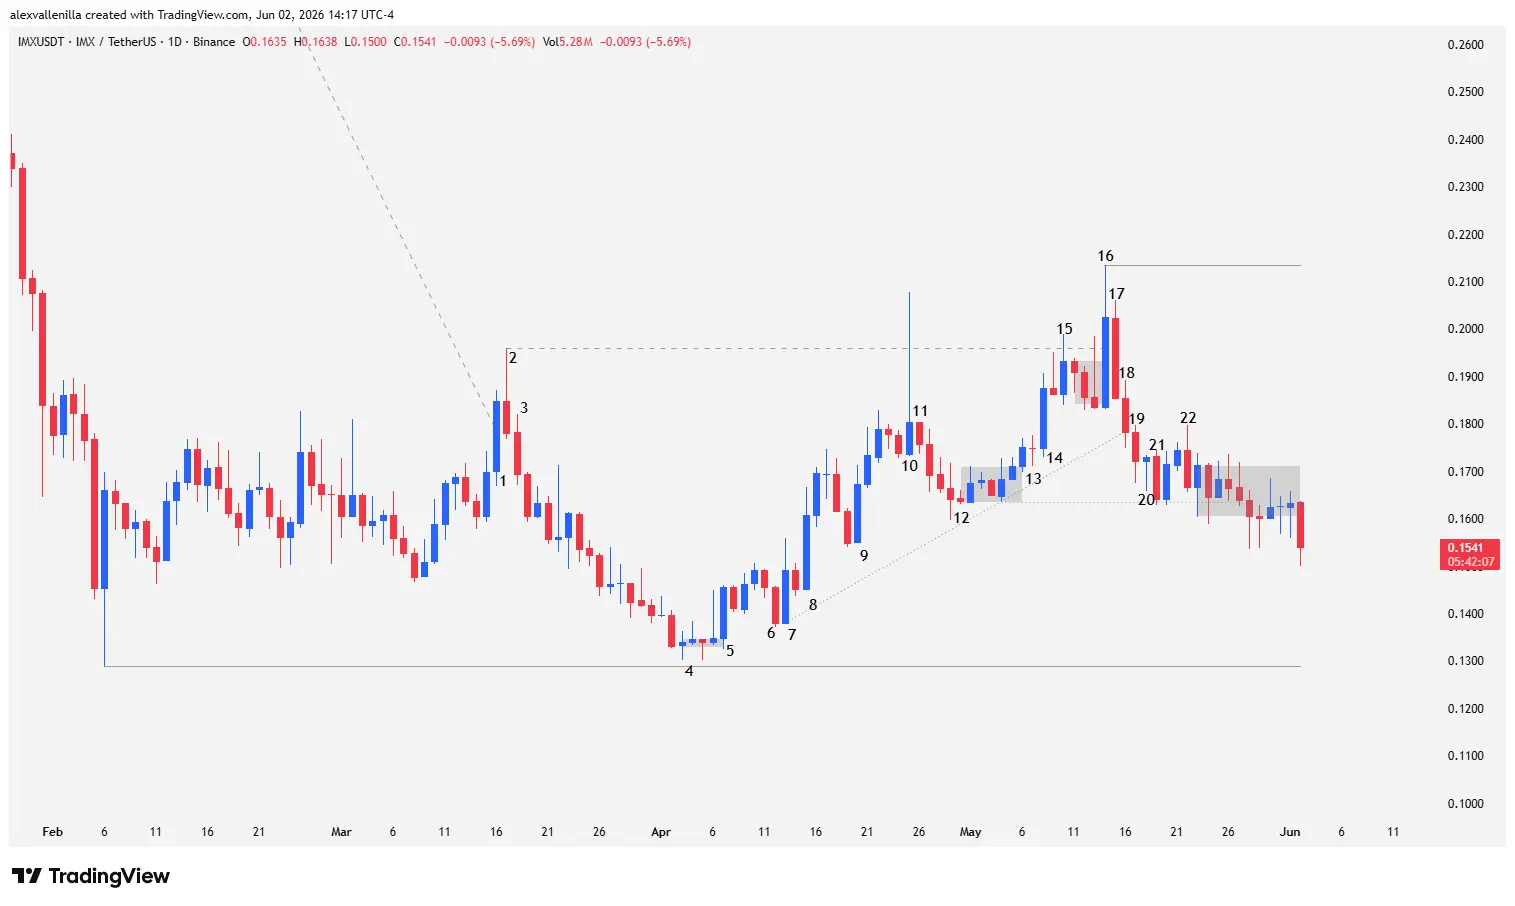
Geometric and order flow analysis on the IMX daily chart details a classic accumulation structure following the breakout of an imposing 467-bar descending trendline. Below, we break down the narrative bar by bar:
Bar 1: An imposing bullish trend bar that demonstrates solid institutional movement. Buyers dominated the session from the open, leaving virtually non-existent tails. This bar broke the 467-day trendline, ending the previous downward movement and initiating the spike and channel pattern.
Bar 2: A bearish reversal with a close at the bottom and a notable upper tail that exceeded its body. This action invalidated the breakout continuity from Bar 1, confirming that supply remained active, though the structure suggests selective profit-taking rather than massive selling pressure.
Bar 3: Confirmation of the pullback. The price closed below the low of Bar 2, triggering a sequence of small bars that threatened to resume the previous trend, denoting a quiet accumulation phase due to low selling conviction.
Bar 4: A small doji halted the bleeding, scrupulously respecting the key support at $0.1290, which corresponds to the last structural low of the bear cycle. From this point on, the price entered congestion without threatening this floor.
Bar 5: First strong evidence of institutional absorption. This bullish bar broke out of the previous congestion, closing near its highs with a minuscule upper tail. It validated a higher low than Bar 4 and activated bullish momentum.
Bar 6: A corrective attempt by the bears with a solid 5.22% drop, showing capital outflow. However, its low remained above bars 5 and 4, weakening the bearish narrative.
Bar 7: Bear trap. Buyers absorbed the previous session’s supply with a strong 8.12% advance. The higher low confirmed active defense of the support. Subsequently, a bearish inside bar failed to provide continuity for sellers.
Bar 8: A new injection of institutional capital. With a 10.74% rally and no lower tail, buyers demonstrated aggressiveness by paying higher prices. The following bar offered continuity before a minor technical pullback of two candles.
Bar 9: A bullish expansion of 8.07% with no lower tail, breaking above the previous high. However, subsequent sessions showed deceleration, narrow bodies, and upper tails, alerting to the presence of sell order blocks.
Bar 10: A session of extremely high volatility. Bulls attempted to force a breakout above the high of Bar 2, but sellers violently defended the resistance at $0.1959. The price rejected the zone, leaving a massive pin bar whose upper tail quadrupled the body size. This failed breakout formally ratified the trading range boundaries.
Bar 11 and 12: Bar 11 confirmed the selling rejection at the range highs. Bar 12, a minuscule bearish inside bar with the smallest body of the corrective sequence, evidenced a loss of bearish momentum within a “barb wire pattern” congestion. The fifth low of this structure served as an anchor to plot a 33-bar bullish micro-channel.
Bar 13 and 14: Bar 13 breached the barb wire congestion. After a bearish feint, Bar 14 validated buying conviction at higher prices with a clean 7.32% move, trapping lagging sellers and breaking above the high of Bar 11.
Bar 15: Second frustrated assault on the resistance. This bullish outside bar momentarily pierced $0.1959, but the close landed below the line. The market failed a second time to consolidate the breakout, trapping the price in a new bearish inside bar.
Bar 16: A bullish explosion of 10.35% at the close. With a much wider range than previous impulses, the price managed, for the first time, to close above the critical resistance at $0.1959, establishing a new technical ceiling at $0.2135. Furthermore, it formed a tweezer bottom pattern (identical lows) with the preceding bar. Despite the achievement, the bar closed with an extensive upper tail (close to 30% of its total range), revealing heavy profit-taking.
Bar 17: Catastrophic breakout failure. This strong bearish conviction inside bar failed to provide continuity to Bar 16’s breakout and did not trigger the buy signal at highs. Smart money rejected the upper zone; the close at the lows with no lower tail demonstrated absolute dominance of supply, culminating the two-legged move that originated at Bar 7.
Bar 18: Bearish continuity. The price pierced and closed slightly below the 33-bar bullish micro-channel line, confirming that the previous resistance breakout was a bull trap.
Bar 19: A bearish closing candle that ratified the micro-channel breakout and structured a Low 2 technical setup at the top of the sideways range.
Bar 20: The breach of Bar 19’s low formally activated the sell signal of the Low 2 pattern, accelerating the corrective move.
Bar 21 and 22: Following a pause of minor bullish bars, Bar 22 acted as a bearish outside bar with a lower high relative to sessions 16 and 17. Currently, IMX trades within tight congestion with an immediate bearish bias, looking to retest the lower boundary of the macro range.
Where Is Immutable Headed Next?
IMX’s technical anatomy demonstrates that the asset is in a classic accumulation phase and structural indecision. While persistent rejection at the $0.1959 – $0.2135 resistance band keeps immediate control in the hands of short-term sellers, the bears’ inability to pierce critical support at $0.1290 corroborates that institutional capital is propping up the price at historical lows. A clean breakout and candle close above the $0.2135 level will be the indispensable catalyst to signal the start of a new bull cycle.
Disclaimer: This analysis is presented for informational and educational purposes only. It does not constitute, nor should it be interpreted as, financial advice, an invitation, or an investment recommendation. Cryptocurrencies are highly volatile assets; only risk capital you are willing to lose.
Communications Professional. Crypto Enthusiast. Economic Journalist. Bitcoiner & Altcoiner.