The cryptocurrency market suffered a heavy blow in the last 24 hours. During a trading session marked by high macroeconomic volatility, bitcoin’s price recorded an aggressive 6.73% drop, dragged down by a combination of US economic data that pushes rate cuts further away and persistent geopolitical uncertainty. The primary trigger was the extreme resilience of the labor market with the JOLTs report, coupled with a notable expansion in manufacturing activity according to the ISM index. This macro outlook, combined with inflationary fears stemming from the Strait of Hormuz crisis, sounded alarms on Wall Street and triggered a massive panic sell-off (FUD) by smart money, breaking key technical support levels.
Jobs Soar and the Industrial Sector Accelerates: Goodbye to Rate Cuts?
The US macroeconomic landscape took an unexpected turn that weakens the bullish narrative for risk assets. On one hand, job openings from the April 2026 JOLTs report skyrocketed by 731,000, reaching a total of 7.618M—their highest level since November 2024. This figure shattered consensus forecasts, which projected a moderate 6.88M, also beating the previous print of 6.887M. Job growth was led by professional and business services (+668,000), while voluntary quits (3.0M) and layoffs (1.7M) remained stable.
To further complicate the inflation outlook, the US industrial sector showed strength not seen in years. The ISM Manufacturing PMI rose to 54 in May 2026, beating the 52.7 from previous months and topping forecasts of 53. This reading signals the strongest manufacturing expansion since May 2022, driven by an acceleration in new orders (56.8) and production (54.3). Although factory price pressures eased slightly compared to April (82.1 vs 84.6), they remain at highly elevated levels.
What Does This Mean for Investors?
An economy generating massive employment and a manufacturing sector expanding at a record pace completely eliminate the Federal Reserve’s urgency to cut interest rates. Capital becomes more expensive, and investors prefer to take refuge in traditional yields rather than volatile assets like cryptocurrencies.
Crisis in the Strait of Hormuz and a Tensely Calm Dollar
The global geopolitical context added fuel to the fire. Bitcoin traders and traditional markets continue to watch the crisis in the crucial Strait of Hormuz shipping lane with extreme caution. The US currency’s value moved sideways ahead of expectations for a potential peace agreement between the US and Iran, after US President Donald Trump assured the continuation of bilateral negotiations, temporarily mitigating pessimistic reports from the Iranian press.
However, fear of inflationary pressures resulting from a prolonged closure of that maritime route halted the US dollar’s advance. The Dollar Index (DXY) traded at 99.21 points, printing a slight decline of 0.04%. Although the DXY did not skyrocket, fear of a global energy shock sowed distrust across the crypto ecosystem, incentivizing profit-taking.
Technical Analysis: Climax Bar and Bull Trap in Bitcoin
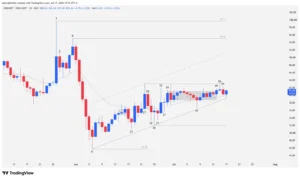
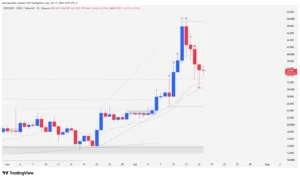
The chart impact on the king crypto asset was immediate following the news of US economic strength. After failing in late May to break above the psychological resistance at $82,250—which turned out to be a painful bull trap—bitcoin’s price action succumbed to institutional selling pressure.
The price pierced the lower boundary of an ascending channel that had remained intact for 116 bars on the daily chart. This breakout triggered a massive “climax bar,” a technical formation that denotes buyer capitulation after a two-legged downward move. Despite the heavy blow, bitcoin’s price holds above critical support at $65,000. This zone represents the key point of control for the macro structure; losing it could quickly send the market searching for lower levels.
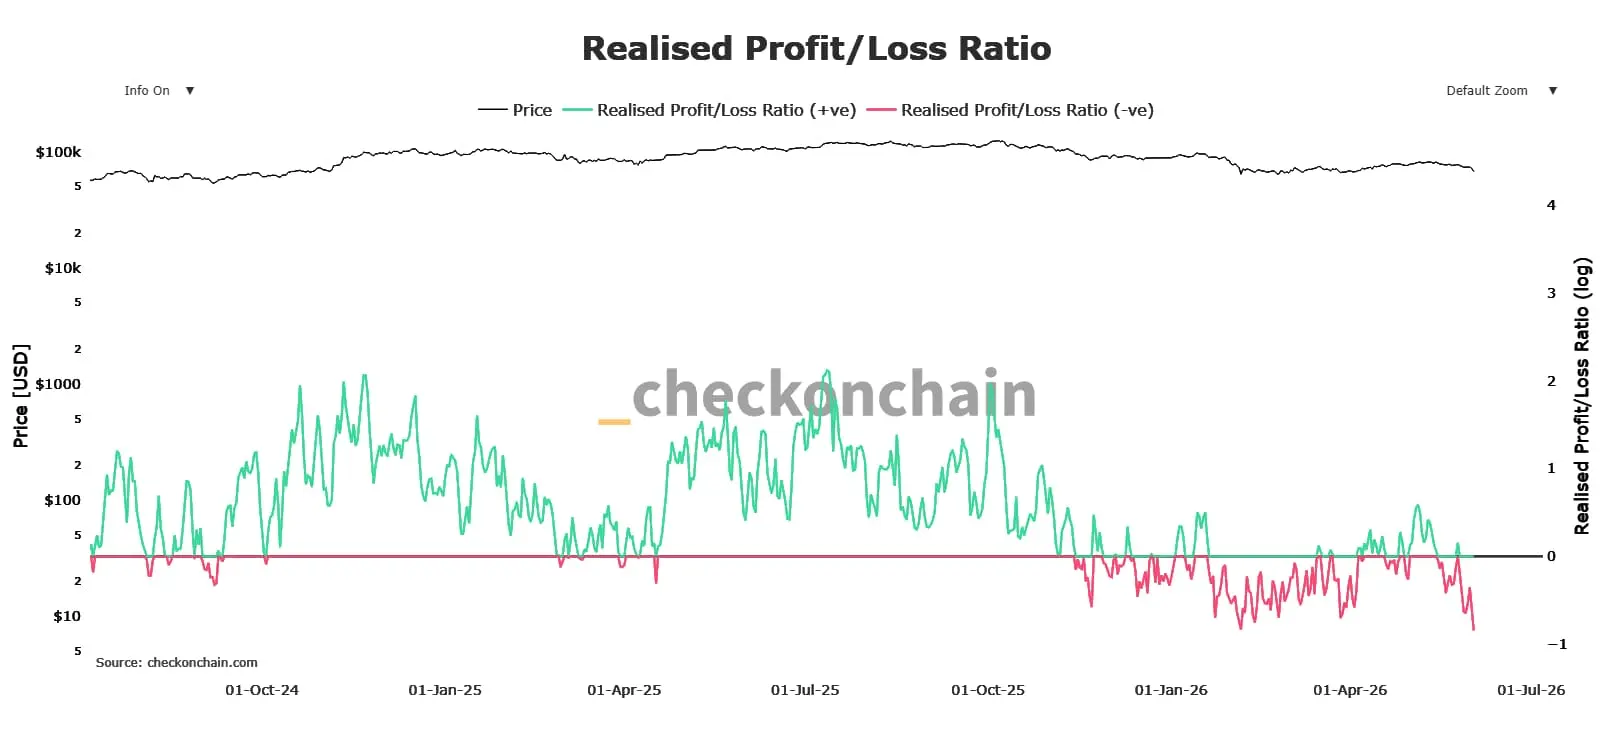
The Realised Profit/Loss Ratio Indicator Confirms Historic Capitulation
The magnitude of investor panic showed up clearly on Bitcoin network on-chain metrics. According to CheckonChain’s Realised Profit/Loss Ratio indicator, the market experienced its largest loss-taking event so far this year.
The indicator dropped drastically to -0.84287 points (negative value). In blockchain data analysis, such a deep negative ratio means that the volume of investors selling their coins below their purchase price reached critical levels, surpassing the previous record on February 5, when it hit -0.833182 points. This proves that fear led even medium-term investors to realize losses just to exit the market.
Market Outlook and Closing
In the short term, bitcoin absolutely needs to consolidate institutional support at $65,000. US macroeconomic strength (thanks to the industrial sector and the JOLTs report) changed the rules of the game for the summer of 2026. If geopolitics in the Strait of Hormuz cool down, we could see a technical rebound due to the seller exhaustion reflected in the current climax bar. Otherwise, liquidity will seek refuge outside the crypto ecosystem.
Disclaimer: The information presented in this report is provided for informational and educational purposes only. It does not constitute, nor should it be interpreted as, financial advice, investment recommendations, or an invitation to execute trading operations.
Communications Professional. Crypto Enthusiast. Economic Journalist. Bitcoiner & Altcoiner.