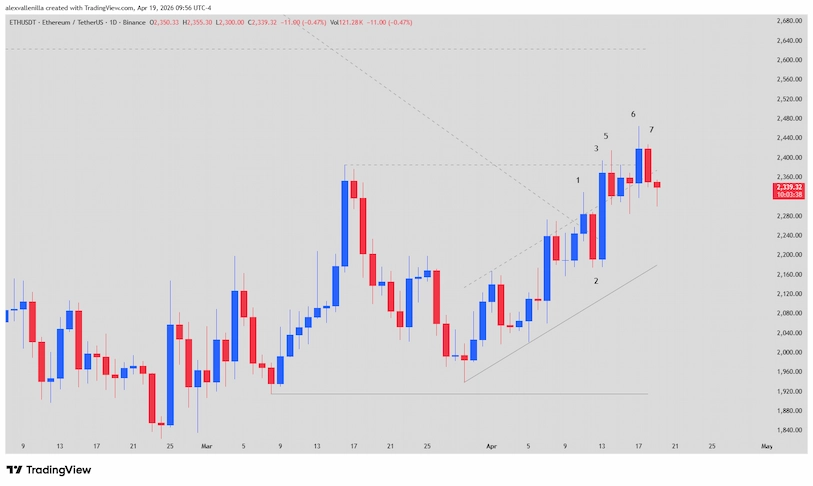
The digital asset market is at a critical tipping point. After a 188-bar period where bears dominated price action from highs of $4,960, Ethereum (ETH) finally pierced its primary trendline. Currently trading at $2,340 with a year-to-date return of 47.26%, Vitalik Buterin’s network is fighting to flip a psychological resistance into solid support. The move depends on validating $2,390—a level that separates the current bullish microchannel from a potential reversal toward corrective levels.
Market Pulse: Between Microchannels and Historical Resistance
Ethereum‘s current context reveals a deep technical transition. Price has abandoned the free-fall structure to enter what analysts call a “Breakout Leg.” This move, born after the March low, is traveling through a 20-bar microchannel that defies the gravity of previous months.
However, obstacles remain. The $2,390 level acts as a Major Lower High. Clearing this wall involves more than just a number; it requires a shift in structural sentiment to move from a defensive market to one of accumulation or a frank uptrend.
Technical Analysis: The 7-Bar Narrative
To understand ETH’s direction, we must break down the battle of the recent sessions, where each bar tells a story of capitulation and resistance.
Bar 1 (Weak Bull Surprise): Buyers executed the first breakout attempt. Although price rose 1.78%, the upper wick revealed that bears were still guarding $2,390. This red flag confirmed that bearish liquidity remained intact.
Bar 2 (Bear Surprise/Bull Trap): A solid bearish candle attempted to punish those who bought the Bar 1 breakout. However, by failing to test the lower support of the bull channel, sellers demonstrated a loss of relative strength.
Bar 3 (The Game Changer): The market generated an 8.11% bullish surge. This candle trapped Bar 2 sellers and forced them to cover positions (short squeeze). The close near the high and above $2,390 shifted the technical bias in favor of the bulls.
Bar 4 and 5 (Consolidation and Pause): Following the momentum, the market took a breather. Bar 5, acting as an Inside Bar, showed that traders were accepting the new price levels rather than violently rejecting them.
Bar 6 (Breakout Confirmation): Despite the volatility, this bar closed above the body of Bar 3. With this, buyers validated their intent to reclaim the conflict zone.
Bar 7 (Immediate Continuity Failure): Currently, ETH is printing a bearish inside bar. The market is entering a “range mode” where price digests the breakout. As long as bears do not pierce the low of Bar 6, the structure remains constructive.
Projections: Toward $2,600 or Back to the Tunnel?
Price action analysis suggests buyers hold the steering wheel. The most likely scenario (60%) points to Ethereum targeting the $2,600 zone following this consolidation. This former support now functions as a resistance that attracts price like a technical magnet.
If bulls fail to defend $2,390, the market would enter a sideways phase between $2,200 and $2,400. Losing dynamic support at $2,200 would invalidate the current microchannel and reopen the door to $1,900. For now, the resilience of the blue candles against the weakness of the red ones suggests that Ethereum is building a solid floor for its next major move.
Disclaimer: This analysis is for informational and educational purposes only. It does not constitute financial advice. Investing in crypto assets carries high risk due to market volatility.
Communications Professional. Crypto Enthusiast. Economic Journalist. Bitcoiner & Altcoiner.