The Venice Token (VVV) market experiences extreme volatility on the daily timeframe after hitting its year-to-date all-time high at $21.46. The movement, driven by a heavy injection of institutional liquidity, culminated in an aggressive 20.03% intraday crash (Bar 12). This event sounded alarms of a potential exhaustion in the 37-bar acceleration trend. However, the subsequent lack of bearish continuity and the sporadic defense of structural support at $14.39 keep traders on edge, balancing yearly metrics that still consolidate an extraordinary year-to-date return of 996.04% so far in 2026.
VVV at a Crossroads After Reaching the Sky
The digital finance ecosystem witnesses one of the most aggressive order flow battles of the quarter within the Base network. Venice Token, the AI-driven privacy asset, scaled vertically within a 114-bar macro structure. Nevertheless, upon reaching the upper psychological band, institutional algorithms executed massive profit-taking, stopping retail optimism dead in its tracks.
Despite the virulence of the selling pressure, the token’s fundamental and technical background reflects remarkable resilience. With accumulated gains of 590.76% over the last twelve months, the price currently wavers between validating a deep correction toward lower control levels or absorbing floating supply to resume its upward trajectory.
Technical Analysis (Top Priority): Bar-by-Bar Price Action Reading
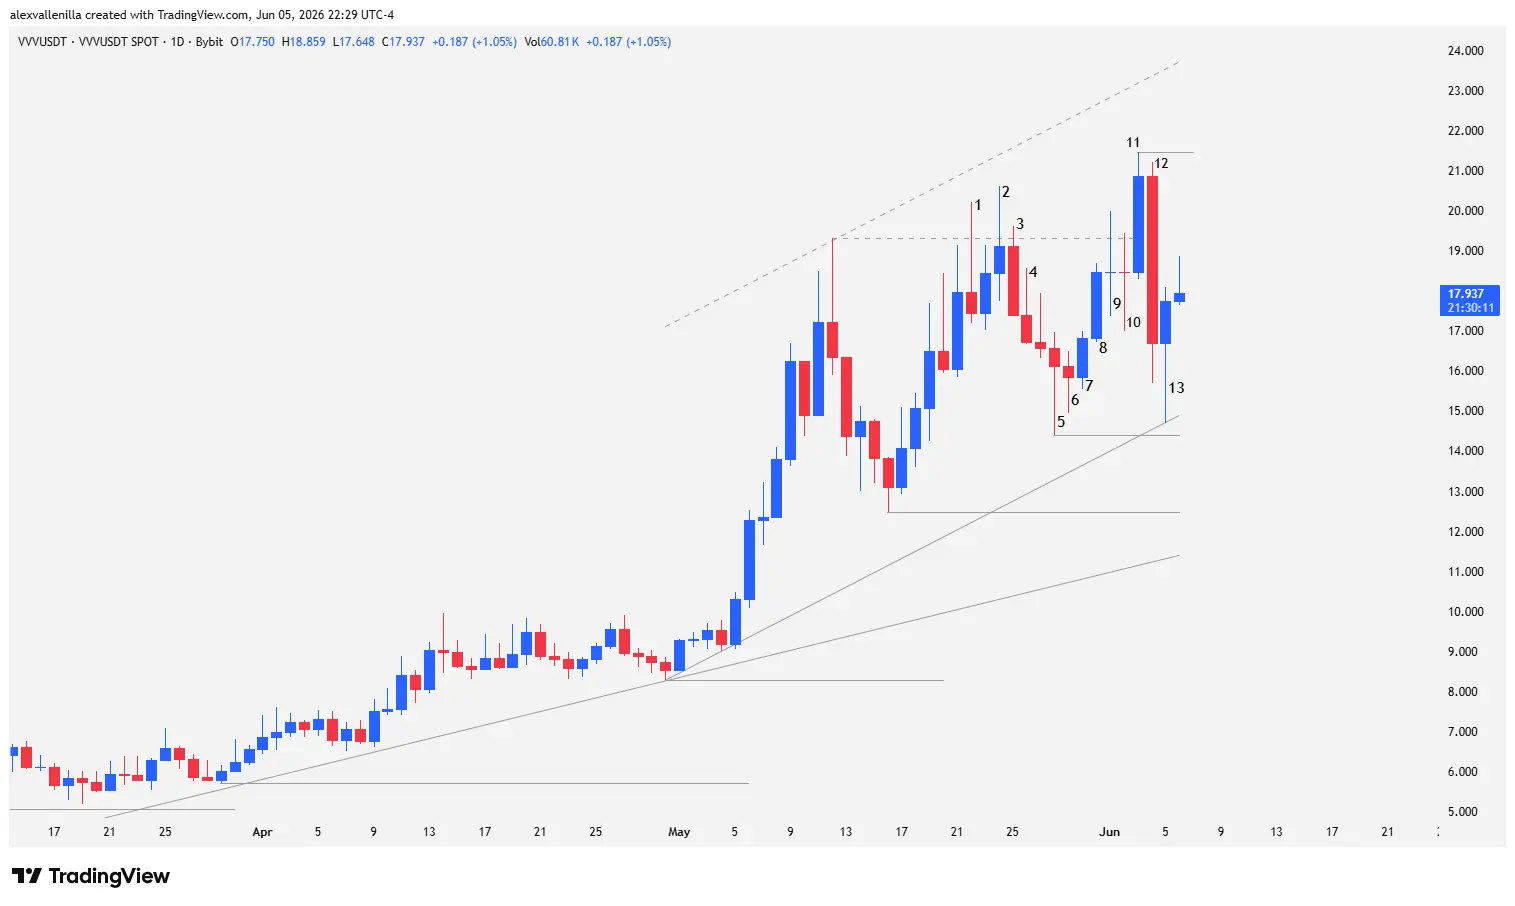
Price behavior on the VVV daily chart reveals the psychology and positioning of market participants through direct interaction with structural levels, bypassing lagging indicators:
Bar 1: A bearish-closing pinbar opens the conflict zone. Its prominent upper wick and narrow body evidence the first blunt rejection at the key resistance of $19.32, a level defining the high of a previous impulse in the acceleration channel. Bulls attempted the breakout but collided with a dense block of limit sell orders and profit-taking.
Bar 2: A second breakout attempt of $19.32 takes place. Despite momentarily piercing the level, the price cannot sustain itself and closes leaving another upper tail. This double-failure pattern invalidates buying momentum, confirming the vulnerability and weakening of demand at highs.
Bar 3: A wide-range bearish bar completely engulfs the body of Bar 2. The absence of a lower wick reflects sustained selling pressure until the final second of the session, triggering a high-conviction retracement.
Bar 4: Confirmation of the bearish bias. The price breaks and closes below the low of Bar 3, extending short-term selling inertia.
Bar 5: A bearish-closing pinbar with notable absorption at the base. Its extensive lower tail, substantially larger than the body, marks a higher low relative to the previous structure and defines a critical horizontal support at $14.39.
Bar 6: An inside consolidation candle signaling a pause in the retracement started in Bar 3. A clear deceleration pattern emerges: the bodies of the bearish bars gradually shrink, revealing supply exhaustion to push the price to lower levels.
Bar 7: Buyers immediately regain control, printing a price action reversal with a higher high than Bar 6.
Bar 8: A wide-range bullish candle whose body covers almost its entire spread. This represents a high-probability High 2 buy setup; however, because it failed to test the resistance at $19.41 and approached the $19.32 wall, the risk/reward ratio remained mathematically inefficient for institutionalized long positions.
Bar 9: Doji formation. Its high exceeds that of Bar 8, triggering the stop market orders of lagging traders. Despite piercing the resistance, the inability to close above $19.32 seals the third consecutive failure of buying pressure.
Bar 10: An extended-range Doji with a bearish close. Supply reaffirms its dominance in the fixed resistance zone, neutralizing bullish expansion efforts.
Bar 11: Buyers print a vertical acceleration vector with buying climax characteristics. The price smashes through the $19.32 resistance and breaks above the high of Bar 2, validating the trend structure. However, the price establishes its new all-time high (ATH) at $21.46 without managing to test the upper line of the bullish channel, denoting a loss of momentum due to structural divergence.
Bar 12: A violent, corrective move by smart money. This massive bearish conviction bar crashes the price by 20.03% through direct market sell orders from the open (tiny upper tail). The close breaches the lows of Bars 11 and 10. The magnitude of this institutional profit-taking anticipates a severe correction for the coming weeks if the bar’s range is not invalidated to the upside.
Bar 13: A bullish-closing pinbar halts the bearish continuity of Bar 12. Its lower wick spans two-thirds of the candle’s total range, finding support above $14.39. This rejection served as a dynamic anchor to adjust the counter-trend line of the 37-bar acceleration. Despite the absorption, it denotes low buying conviction, suggesting that bulls will require significantly higher volume to absorb the bearish block inherited from the previous session.
Key Scenarios for the Medium Term
The three-push structure in the bullish channel warns of a mature exhaustion of the acceleration trend. If buying pressure manages to invalidate the high of Bar 12 ($21.46), the 114-bar macro scenario will seek price discovery. Otherwise, losing the immediate dynamic support at $14.88 will force a capitulation toward the critical point of control located at $12.48.
Disclaimer: The opinions and analyses presented in this article are purely educational and informational and do not constitute financial advice or investment suggestions. Every trader is responsible for their own risk management.
Communications Professional. Crypto Enthusiast. Economic Journalist. Bitcoiner & Altcoiner.