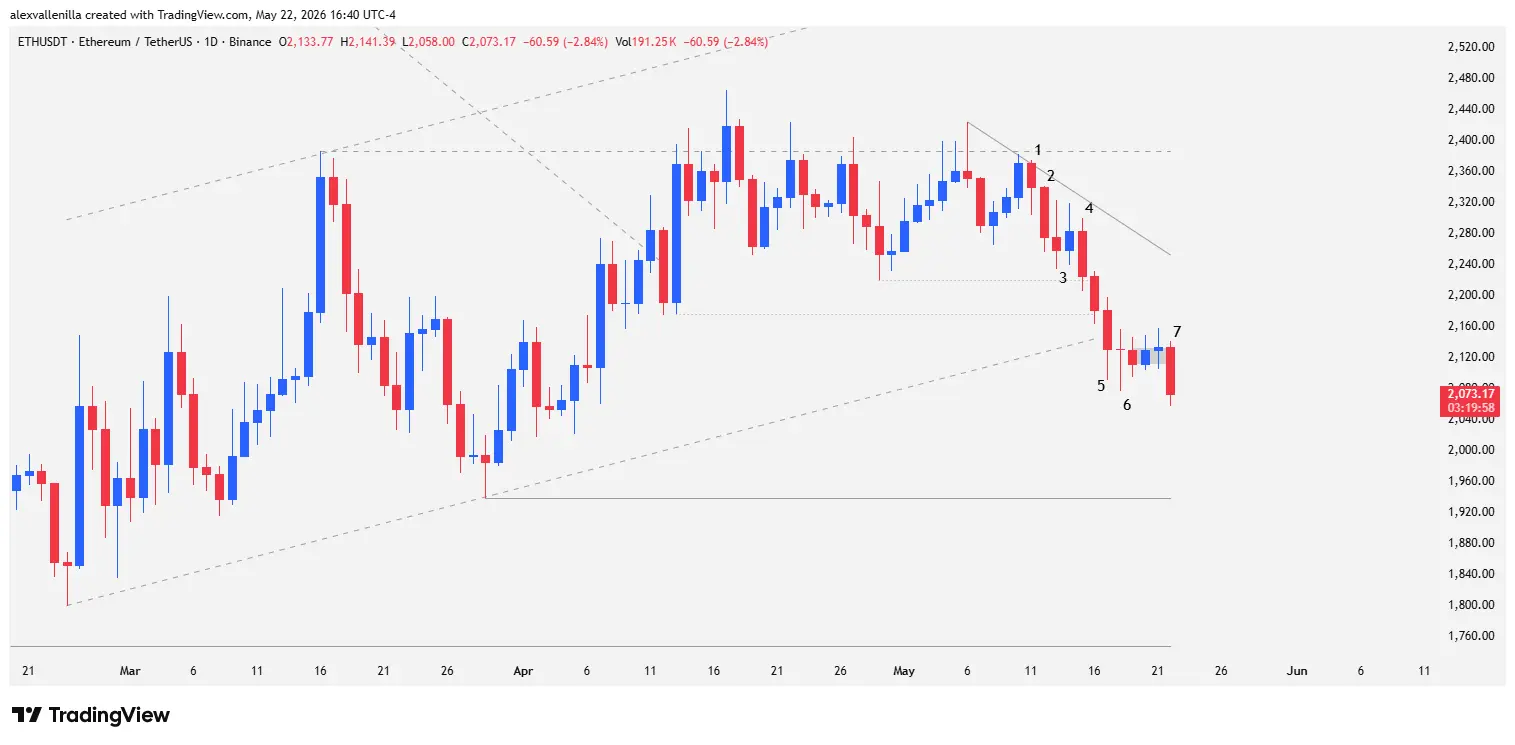
The cryptocurrency market is once again teaching a lesson in patience and technical discipline. Ethereum (ETH) is trading at $2,073.17, posting a moderate 2.84% decline over the last session after validating a complex bull trap on its daily chart. Buyers, who spent 81 trading bars building a bullish microchannel to shake off a heavy preceding 188-bar downtrend, finally capitulated at the psychological and technical resistance of $2,386. This strategic rejection pierced the bullish trendline and activates bearish projections pointing directly toward technical support at $1,940.
Anatomy of the Rejection: Technical Analysis of Price Action
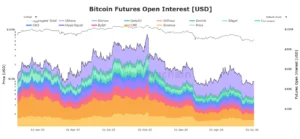
Ethereum‘s recent behavior on the daily (1D) timeframe demonstrates how institutional liquidity zones operate as magnets and, conversely, as insurmountable barriers when buying volume fails to support the move.
Below is a breakdown of the technical narrative through the last seven key bars on the chart:
Bars 1 to 3: Setting the Bull Trap and Triggering the Short
Bar 1: A bearish pinbar candle with a lower tail the size of its body. Its high fails to test the key resistance at $2,386, confirming the fifth consecutive breakout failure in this zone. Bulls attempted to breach this level multiple times, but Bar 1 sealed the immediate fate of the price by becoming a liquidity trap at the top of the range. The $2,386 level represents the last relevant high of the 188-bar downtrend.
Bar 2: Bears take control with a solid-bodied, highly efficient candle. Showing no significant upper tail, it proves that supply sold aggressively. This bar sets up a high-probability Low 2 short setup. The persistent influence of the macro downtrend caused every rally in this area to be immediately sold off. The short sell signal formally triggered when the following candle pierced the low of this Bar 2, executing market stop orders of the traders who set up the trade.
Bar 3: Buyers attempt a reversal through a bullish inside bar. However, the move is extremely weak, showing a narrow range that denotes a lack of conviction. Although it sought to trap premature sellers by taking advantage of the previous bar failing to break the floor of the range, Bar 3’s high does not even approach Bar 2’s high. This left the bears’ stop-loss levels completely intact.
Bars 4 to 7: Channel Breakout and Congestion Phase
Bar 4: A new bearish session completely invalidates Bar 3’s attempted reversal, attracting further selling pressure to the market. The low of this bar pierces the trading range, and while it fails to close below it, bearish continuity materializes the following day, where the price seeks and pierces intermediate support at $2,175.
Bar 5: This candle unfolds in a vertical breakout move, showing almost zero overlap with Bar 4. It successfully closes below $2,175 and definitively fractures the 81-bar bullish microchannel. Despite its strength, Bar 5 leaves a pronounced lower tail, signaling that buyers attempted to absorb the circulating supply. The subsequent session (Bar 6) prints a long-tailed doji that temporarily halts the bleeding, but the close sits strictly below the broken trendline. Following Bar 6, price enters a congestion pattern of three fully overlapping candles (wire or barbed wire).
Bar 7 (Current): At the time of writing, the current bar cleanly breaks down out of the congestion pattern. This move validates the bearish structure initiated in Bar 1 and confirms that bears maintain market direction.
Market Outlook and Price Projections
At the macro level, losing the 81-bar bullish microchannel is a heavy blow to the immediate recovery narrative. Nonetheless, the decline from Bar 1 is not entirely uniform: Bar 2 stands out as the only truly clean impulse, while subsequent candles exhibit smaller bodies and tails that denote volatility and indecision.
Bearish Scenario (Higher Probability)
If Bar 7 consolidates its breakout below the congestion zone, Ethereum’s price will highly likely seek support at $1,940. This level is critical, as it functions as a control point and anchor for the prior bullish trend, acting as a natural magnet for price. If this support fails, ETH will enter a danger zone, risking a drop toward $1,750, where a breach would mean the formal resumption of the primary downtrend.
Bullish Scenario (Lower Probability)
For buyers to regain control, price would first face a key dynamic resistance: a 16-bar descending trendline that currently pressures price in the $2,250 zone. A successful bounce at $1,940 that fails to clear $2,386 would trap Ethereum in a wide accumulation range, extending the transition phase before attempting a new bullish cycle.
Ethereum pays the price for the weakness of its buyers, whose final upward charges featured small, overlapping candles with upper wicks that betrayed exhausting demand. The loss of the 81-bar channel forces investors to closely monitor the $1,938 zone; volume behavior at that level will determine whether ETH begins a healthy accumulation phase or heads toward a prolonged crypto winter.
Disclaimer: The information presented in this article does not constitute financial advice or investment recommendations. Crypto asset prices are highly volatile. Every trader must conduct their own technical analysis and risk management before making market decisions.
Communications Professional. Crypto Enthusiast. Economic Journalist. Bitcoiner & Altcoiner.