Stargate Finance (STG) is experiencing a powerful bullish acceleration. After consolidating a solid support structure, the asset unleashed a parabolic move that challenges key resistance levels. We analyze, candle by candle, whether this buying euphoria has the institutional backing necessary to sustain the trend or if we are facing a climactic exhaustion point.
Anatomy of Institutional Strength
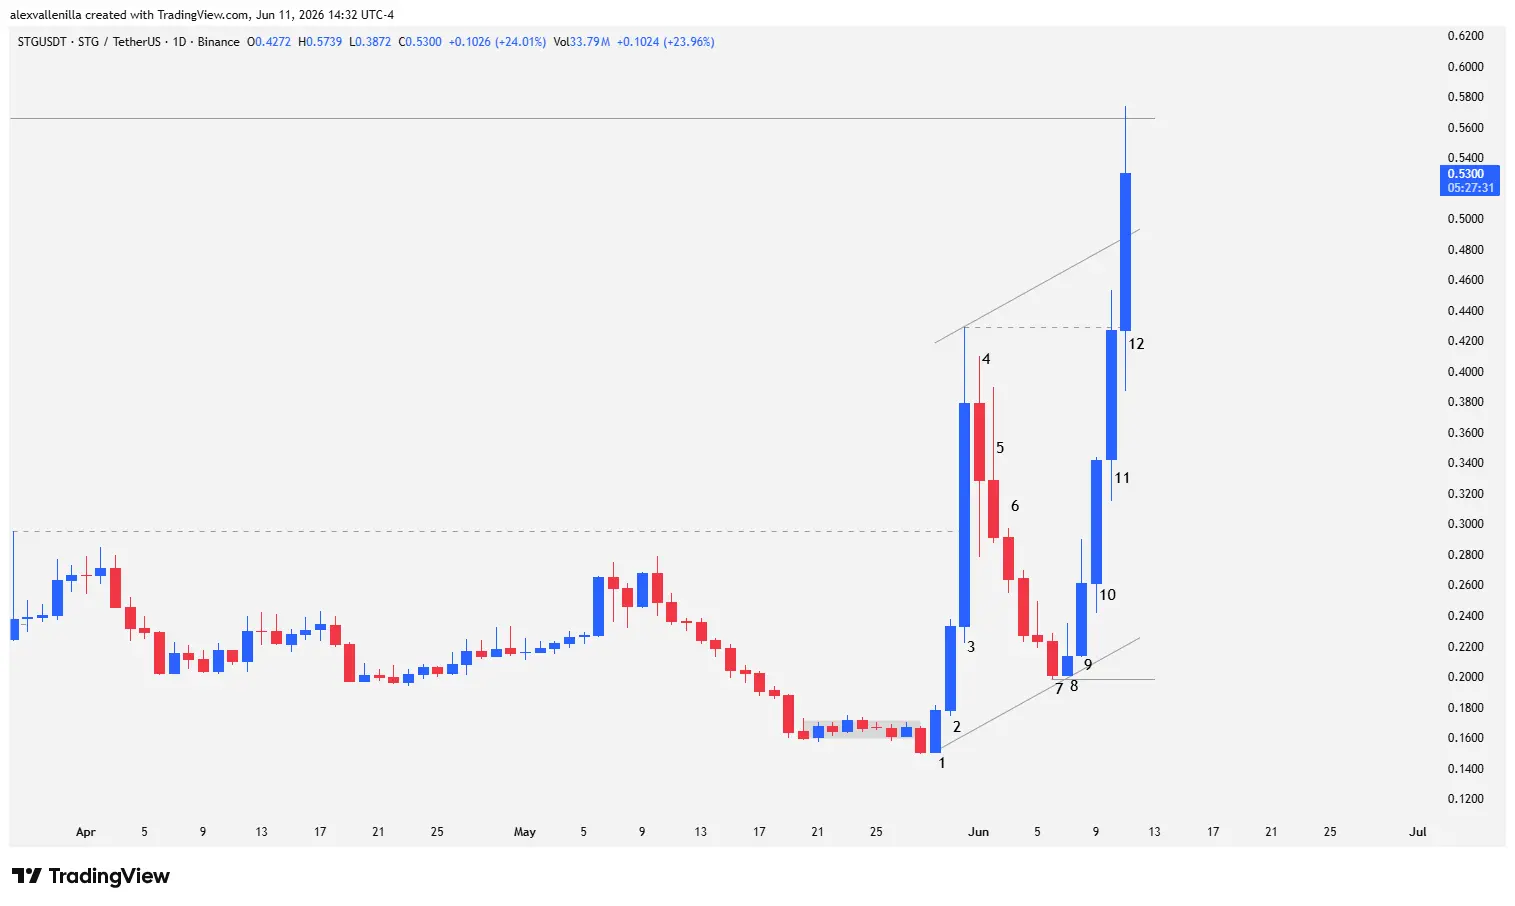
STG’s bullish move is no coincidence. Bar 1 and Bar 2 established the foundation: a High 1 and High 2 buy setup that trapped bears attempting to break the previous congestion. However, it was Bar 3 that set the institutional tone with a 63.06% surge.
These types of candles, being climactic in nature, act as a double-edged sword: on one hand, they confirm massive interest, but on the other, they create inefficiencies by rising vertically, which invites rapid corrections.
Technical Structure and Consolidation
After the Bar 3 peak, the market sought a natural equilibrium. Bars 4, 5, and 6 represented a profit-taking phase. It is vital to observe that although bears managed to pierce the low of Bar 5 on Bar 6, the lack of conviction—seen in the decreasing candle bodies—indicated that supply lacked the pressure to reverse the trend.
Bar 7 was the turning point. By establishing support at $0.1986, it served as an anchor for a new bullish trend line. This level was validated by Bar 8, a bullish pin bar that halted the decline, setting the stage for the final reversal.
Technical Analysis: The Second Leg and the Resistance Challenge
From Bar 9 to Bar 12 (current), we have witnessed a display of pure institutional strength.
Bar 9: Broke the previous bearish micro-channel. With its shaved structure (lacking a significant lower wick), it confirmed that smart money was absorbing supply at higher prices.
Bars 10 and 11: Continued the momentum. Bar 11 showed total market control, exceeding the high of Bar 3, albeit with the warning sign inherent in a climactic climb: a lack of overlap and large candles suggesting buyers are entering “at any price.”
Bar 12 (In progress): Trading at $0.53 with a 24.01% daily gain, volatility is the protagonist. The presence of extensive upper and lower wicks indicates a fierce battle at the $0.5658 resistance.
Probable Scenarios
If STG manages to close above $0.5658, the market will validate a long-term structure change. However, given the parabolic nature since Bar 8, a consolidation or pullback is a highly probable scenario. In the event of a correction, the $0.4291 level (the previous high of Bar 3) must now act as robust support to maintain the bullish thesis.
Market Relevance
With an 183.08% return over the last year and an explosive 127.06% in the last month, STG positions itself as one of the highest-momentum assets in the ecosystem. The key for retail investors will be to observe the price’s ability to stabilize above its new support zones, avoiding entry based solely on FOMO during climactic acceleration bars.
Disclaimer: This analysis is for educational purposes only and does not constitute financial advice. Trading crypto assets carries a high risk of capital loss. Always conduct your own research.
Communications Professional. Crypto Enthusiast. Economic Journalist. Bitcoiner & Altcoiner.