The cryptocurrency market is witnessing a harsh lesson in market psychology and price action on the Solana (SOL/USD) daily chart. Following a failed attempt to consolidate a macro reversal structure, premature buyers fell into a liquidity trap above $97.68. The subsequent loss of dynamic and static supports unleashed an institutional sell order flow that erased a massive chunk of the network’s market cap, compounding a 48.22% year-to-date loss in 2026 and an alarming 59.95% plunge over the last twelve months. Supply completely absorbed demand in a climactic sell-off that leaves SOL standing at the edge of a technical abyss.
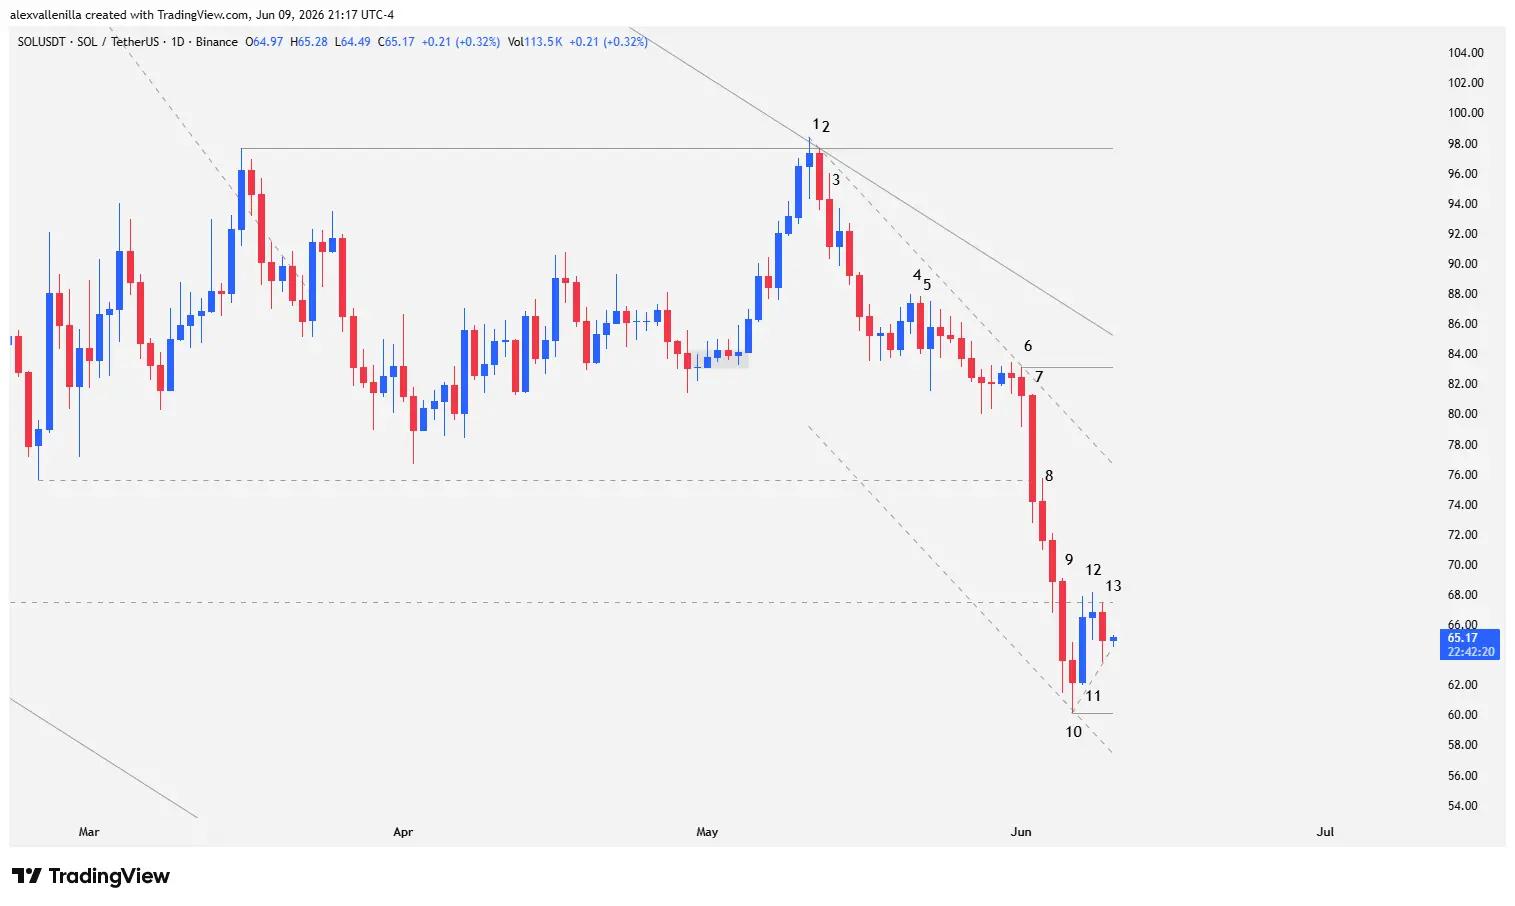
Bars 11 and 13 on the SOL daily chart hint at supply absorption via higher lows at the base of the channel, but the ghost of institutional capitulation from Bar 9 at $65.07 caps trader optimism. / TradingView
Accumulation Range Failure and the Birth of the New Descending Channel
The previous breakout of a 186-bar macro descending trendline generated premature optimism among traders, who assumed the subsequent sideways phase dictated clean accumulation. However, price action systematically proves that a range is merely a temporary zone of equilibrium. To confirm a structural reversal, bulls must effectively breach the previous swing highs.
Failing to secure solid closes above critical resistance makes any bounce the ideal setup for institutional strategy execution: sell the rally. This defensive failure not only trapped “weak hands” but also established an anchor point in the $148.74 resistance zone, validating a structural 148-bar descending channel that maintains absolute control over the asset, accelerating losses by 33.09% over the past month.
Technical Price Action Analysis: Anatomy of a Capitulation
Below, we break down the order flow narrative bar by bar, identifying operational triggers and participant psychology on the daily (1D) timeframe.
Bars 1 to 3: The Origin of the Trap and Short Activation
Bar 1: Bulls attempt to pierce the key resistance at $97.68, a level guarding the high of the bar that broke the previous 186-period trend. Price dilates the level but faces violent rejection, closing below its open. It prints a textbook bull trap. The high of this bar acts as the turning point for the 148-bar descending channel.
Bar 2: A high-conviction bearish candle. Its lower high confirms the rejection at resistance. Professional traders position short sell orders one tick below its low, placing the structural stop-loss above the high of the same bar.
Bar 3: Delivers continuity to the downward move. Structurally, this classifies as a high-probability Low 2 (L2) short setup. Breaking its low in the following session massively triggers sell stops, forcing the liquidation of long positions trapped in Bar 1.
Bars 4 and 5: Absorption of Weak Buying Response
Bar 4: Price experiences a temporary deceleration. Buyers attempt to structure a two-bar technical bounce, but weakness is evident: extremely small bodies, zero conviction, and a lack of absorption volume.
Bar 5: A bearish bar breaks the low of Bar 4. Weak buyers from the previous session are trapped, injecting bearish fuel into the market. Although lower tails appear, denoting some profit-taking by sellers, the absence of institutional buying prevents any reversal attempt.
Bars 6 to 9: Institutional Entry and the Climactic Abyss
Bar 6: The local high of this session acts as a static resistance zone and an anchor point to draw a secondary descending trendline, giving birth to a 30-bar acceleration mini-channel.
Bar 7: Institutional capitulation bar. With an 8.67% collapse, this wide-range candle demonstrates absolute control by market smart money. It executes a climactic two-leg downward move (measured move) from the top of the range. It breaks through intermediate support at $75.63 and closes below it. Additionally, it triggers a highly reliable Low 2 sell signal as the second lower high since the Bar 6 pause zone.
Bar 8: A continuity candle that solidly validates the breakout of the previous support.
Bar 9: Institutions deal a knockout blow. Selling pressure pierces psychological support at $67.50 (a key level untested for 124 bars). Price action formally opens the gates to test historic 932-bar support at $65.07.
Bars 10 to 13: Exhaustion and Counter-Trend Structure
Bar 10: Although bears manage to print a low below Bar 9, price fails to sustain the pressure and closes above that low. Sellers enter a state of extreme exhaustion after the climactic effort, temporarily halting the bearish flow.
Bar 11: Counter-trend buyers enter the market. The bar exhibits a tiny lower tail, confirming that demand pressed from the open. Price pierces $67.50 (former support now acting as polarity resistance) but fails to close above it. Despite this, it closes above the high of Bar 10, activating a High 1 (H1) counter-trend buy setup at the bottom of the 30-bar mini-channel.
Bar 12: A narrow-body doji prints. Its high slightly exceeds that of Bar 11, activating buy stop orders from bounce traders. At the same time, it classifies as a High 2 (H2), but its narrow-range structure reduces its statistical probability. This bar forces short covering from bears holding positions since bars 2, 3, and 7. It fails to close above $67.50.
Bar 13: A defensive pullback bar. Bears attempt to resume the structure following the bullish failure at polarity resistance. However, the candle closes with a pronounced lower tail, printing a structural higher low compared to bars 10 and 11, proving that immediate supply has been temporarily absorbed.
The Order Flow Verdict
Solana remains under the yoke of a dominant bearish structure and a firmly established 148-period channel. For the current bounce structure in bars 11 and 12 to gain macro validity, bulls must defend the low of Bar 11 and neutralize the high of Bar 9. If successful, SOL will look to mitigate dynamic resistance of the mini-channel at $76.69.
However, the outlook remains adverse. If macro support at $65.07 capitulates to institutional order flow, the current absorption scenario will be invalidated, irreversibly opening the path toward the 2023 support zone at $17.33 (1,002 bars back). Price action demands strict caution; the knife is still falling.
Disclaimer: This technical analysis is issued solely for informational and educational purposes based on price action methodology. Under no circumstances does it constitute investment advice, financial recommendation, or an invitation to trade digital assets. The cryptocurrency market is highly volatile; only risk capital you are willing to lose.
Communications Professional. Crypto Enthusiast. Economic Journalist. Bitcoiner & Altcoiner.