The cryptocurrency market proves once again that institutional liquidity rules. Over the last few sessions, Tron’s native token, TRX, staged a violent bearish reversal on its daily chart (1D) after validating and failing miserably at the key $0.37 resistance. This level, which the price had not visited for 284 bars, triggered an aggressive wave of profit-taking by institutional investors and “smart money.” The move invalidated the bullish leg that aimed to project the price toward its all-time high of $0.45, plunging the structure into a macro range and forcing an accelerated correction that now tests key dynamic supports.
Price Action Analysis: The Psychology of the Bar-by-Bar Collapse
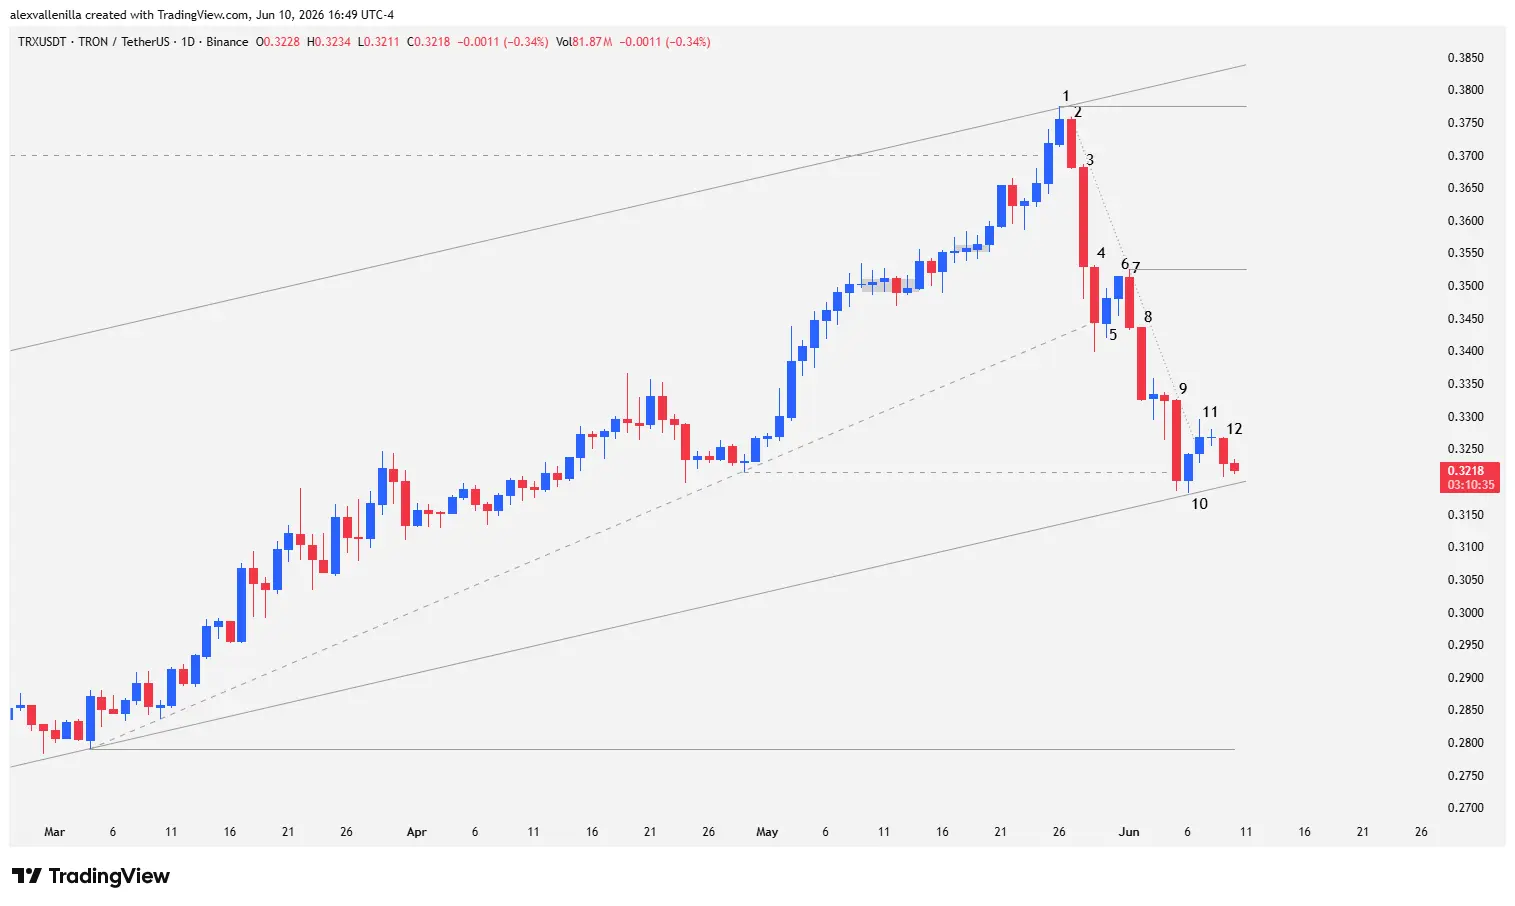
To understand the dynamics of this move and the underlying order flow, we must break down the technical narrative through the interaction between supply and demand on the daily chart:
Bar 1 (B1): Bulls confirm the initial breakout of the $0.37 resistance. The high of this session acts as a technical anchor to establish the ceiling or upper band of a primary ascending channel that has accumulated 125 bars of development. However, after setting a local ceiling at $0.3775, demand runs out of steam.
Bar 2 (B2): A high-conviction bearish candle appears. It shows an almost total absence of an upper wick from open to close, reflecting a massive influx of sell orders. The fact that its high stays below B1 betrays the buyers’ inability to sustain the advance. Closing below $0.37 and breaking the low of B1 triggers a bearish engulfing pattern (a trap for bulls). This activates a technical sell signal as it executes one tick below its low.
Bar 3 (B3): Confirms the crash with a substantial increase in volatility. Showing no overlap with B2 (minimal upper wick), the market validates the imbalance in favor of supply. Price pierces the lows of previous bullish impulses. Although it shows slight absorption at the end of the session, it fails to test the accelerating microchannel.
Bar 4 (B4): Wide-range candle with an extended real body and no upper wick. Bears aggressively liquidate positions. Price pierces the lower band of the 86-bar bullish microchannel, though the close sits subtly above this dynamic support.
Bar 5 (B5): Defines itself as an inside bar. Bulls attempt to halt the cascade of sell orders, but the candle’s small body demonstrates deep weakness and the absence of institutional buying interest to reverse the trend.
Bar 6 (B6): Although it breaks above the high of B5 to continue the attempted bounce, the session closes with a narrow body and an inefficient lower wick. This structures a latent two-bar reversal failure pattern.
Bar 7 (B7): Smart money delivers a definitive blow. This high-conviction bearish candle traps early buyers from B6, using their stop losses as bearish fuel. The move validates the reversal failure, officially breaks the 86-bar bullish microchannel, and establishes a lower high at $0.3526, which functions as a local resistance zone and an anchor for a new 11-bar bearish microchannel.
Bar 8 (B8): Panic candle and widespread institutional liquidation. It lacks an upper wick and closes near its absolute lows, reflecting that institutional traders are liquidating at any available price. A subsequent flat doji generates another reversal failure that accelerates the bearish momentum.
Bar 9 (B9): Another expanded-range bar driven by supply. It breaks the key horizontal support at $0.3215 (the former anchor point of the 86-bar microchannel). Despite the aggressiveness, the session low fails to hit the base of the 125-bar primary channel.
Bar 10 (B10): Temporarily stops the bleeding. This is a small technical bounce candle with low conviction, showing a momentary exhaustion of the selling flow.
Bar 11 (B11): Bulls manage to confirm a two-bar reversal pattern. The close sits above the high of B10 and breaks the trendline of the 11-bar bearish microchannel that originated at B2, calling a halt to the price drop and initiating a low-volatility consolidation phase (inside bar).
Bar 12 (B12): Bears try to regain control by piercing the low of B11, but the session lacks volume and range. Just like in B9, the price fails to test the base of the 125-bar primary ascending channel.
Macrostructure and Technical Outlook: Where is TRX Heading?
Despite the severity of the retracement, contextual analysis reveals that this crash remains encapsulated within longer-term structures. Tron’s primary trend remains firmly bullish, backed by a 1,031-bar macro channel.
The 125-bar channel represents an advancing leg that was targeting the upper side of a giant range bounded between support at $0.2683 and historical resistance at $0.37. Failing the structural breakout, the price re-entered the macro accumulation range.
If the price gives in to pressure and loses the dynamic support at $0.32, it will project an extension of the drop toward the horizontal zone at $0.2790. Conversely, if the price respects the base of the 125-bar channel, the buyers’ first goal will be to reclaim local resistance at $0.3526 to attempt to restructure the long-term trend.
Tron’s recent behavior exposes a classic transfer of contracts from weak hands to institutional order blocks at historical resistance zones. While the 1,031-bar primary bullish structure remains intact, bulls need to build a solid accumulation base within the current range if they intend to challenge institutional sell supplies again and open the door to the psychological $0.45 mark.
Disclaimer: This analysis is issued exclusively for informational and educational purposes based on Price Action methodology. It does not constitute, under any circumstances, financial advice, investment recommendations, or an offer to buy or sell digital assets. Crypto assets exhibit high volatility; trade at your own risk and responsibility.
Communications Professional. Crypto Enthusiast. Economic Journalist. Bitcoiner & Altcoiner.