The BUILDon (B) cryptocurrency market is going through a high-definition technical moment on its daily (1D) chart. Following a massive institutional breakout attempt that slammed into its all-time high of $0.7406, the price experienced a deep pullback driven by profit-taking and retail capitulation. Bears forced a breakdown of a key bullish microchannel, but institutional order flow keeps critical long-term support intact. The crypto asset currently debates its structural future between a high-probability technical bounce and the threat of a severe correction toward macro accumulation lows.
Price Slams into the Last Bearish Bastion
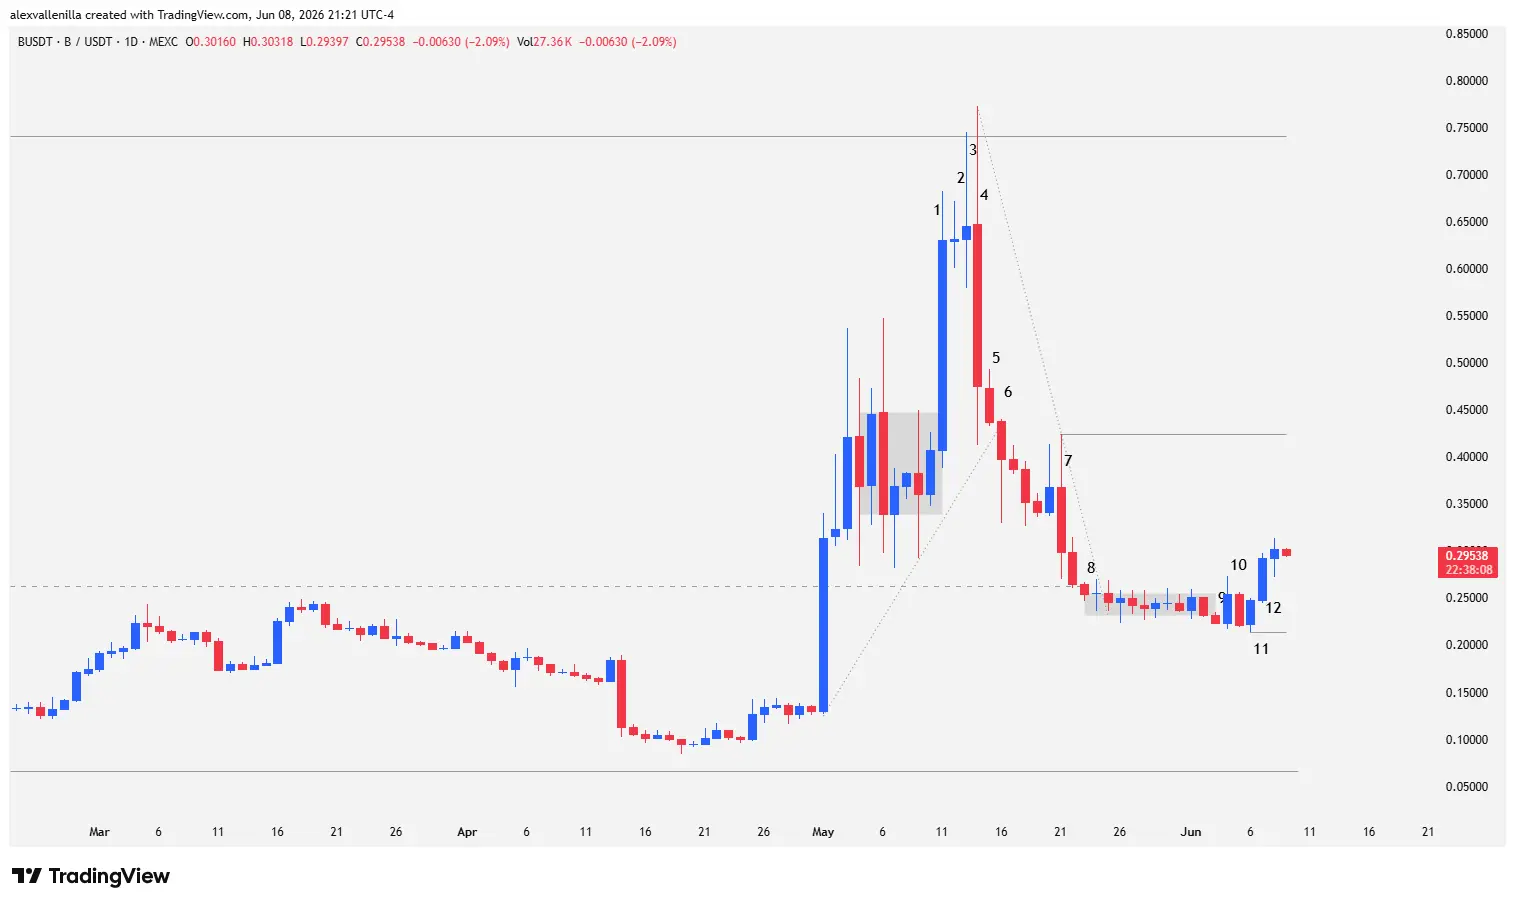
The macro structure for BUILDon (B) shows a textbook Price Action transition: a Spike and Range pattern. After a prior 52-bar markdown trend, the market entered a sideways accumulation phase that lasted 204 bars, compressing volatility and absorbing available supply.
The subsequent institutional expansion generated a two-legged upward move. However, buy order flow collided directly with resistance at $0.7406, the asset’s all-time high and the vertex of the original bearish trend. This level acts as the bears’ last stand, triggering a massive rejection that altered the short-term liquidity map and forced a congestion phase.
Exclusive Technical Analysis: Price Action Anatomy (1D)
The behavior of the last 12 daily bars precisely defines market participant psychology:
Bar 1 (Explosive Impulse): A high-conviction bullish candlestick that expands the range by 54.70%. It breaks out of the prior congestion, driven by institutional buying (smart money). Despite the momentum, the close fails to test the critical $0.7406 level.
Bar 2 (Exhaustion): A doji inside bar. Lower highs and higher lows within the range of Bar 1 confirm that immediate demand dried up after the prior effort.
Bar 3 (Bull Trap): An outside bar. Buyers attempt to pierce historical resistance, but the market violently rejects the move. The long upper wick reveals massive absorption of sell orders.
Bar 4 (Volatility and Profit-Taking): A massive outside bar that reintroduces extreme volatility. The bulls’ failure triggers stop-loss cascades and profit-taking, resulting in a 26.30% retracement. Although the low pierces Bar 3 and nears the origin of Bar 1, wicks on both ends denote latent support sitting on the 15-bar bullish microchannel.
Bar 5 (Pause): A bearish inside bar that consolidates the price, reflecting indecision after the previous session’s volatility shock.
Bar 6 (Trend Breakdown): Bears take short-term control, extending the decline and breaking below the 15-bar bullish microchannel. This event temporarily invalidates the accelerated medium-term bullish structure.
Bar 7 (Pivot Establishment): A bearish outside bar whose high anchors a new 11-bar bearish microchannel and establishes firm local resistance at $0.4236.
Bar 8 (Support Test): Achieves a marginal breakdown below support at $0.2621 (the former ceiling of the 204-bar accumulation range). Following this bar, selling pressure neutralizes, entering a sideways range. Two bars later, price breaks out of the 11-bar bearish microchannel, halting the bleeding.
Bar 9 (False Bearish Breakdown): An insignificant attempt by bears to resume the markdown trend, barely managing to close below the congestion.
Bar 10 (Bear Trap): A bullish outside bar that invalidates the previous bar’s breakdown, trapping late sellers (short squeeze). Price maintains sideways price action for two more sessions.
Bar 11 (Local Floor): This session’s low establishes definitive support at $0.2139, halting the corrective sequence.
Bar 12 (Conviction Reversal and High 2): A strong bullish bar with an 18% expansion. The absence of a lower wick proves that buyers controlled the auction from the open. The subsequent bar confirms continuation, validating a high-probability High 2 buy setup (the second attempt to resume the bullish trend within a corrective structure).
Structural Scenarios for BUILDon
The current deep correction lacks the volume and block-trade characteristics typical of smart money distribution; long-term institutional investor positioning remains intact. The market stands at an inflection point with two clearly defined scenarios:
Bullish Scenario (High 2 Validation)
To regain medium-term bullish momentum, buyers must push price above local resistance from Bar 7 at $0.4236. Consolidation above this technical pivot will reopen the doors to retest macro resistance at $0.7406.
Bearish Scenario (Capitulation)
If selling pressure invalidates the High 2 pattern and price loses local support from Bar 11 at $0.2139, it will confirm structural weakness. This would trigger massive sell orders toward historical 243-bar support, located at the base of the old sideways range at $0.06575.
The BUILDon (B) cryptocurrency is executing a classic retest of prior accumulation zones. The preservation of institutional support and the recent High 2 buy setup suggest that the market is flushing out retail leverage before gunning for a new test of its all-time highs.
Disclaimer: This analysis is issued exclusively for informational and educational purposes from a price action perspective. Under no circumstances does it constitute financial investment advice or an explicit recommendation to buy or sell digital assets. Cryptocurrencies exhibit extreme volatility; only risk capital you are willing to lose.
Communications Professional. Crypto Enthusiast. Economic Journalist. Bitcoiner & Altcoiner.