

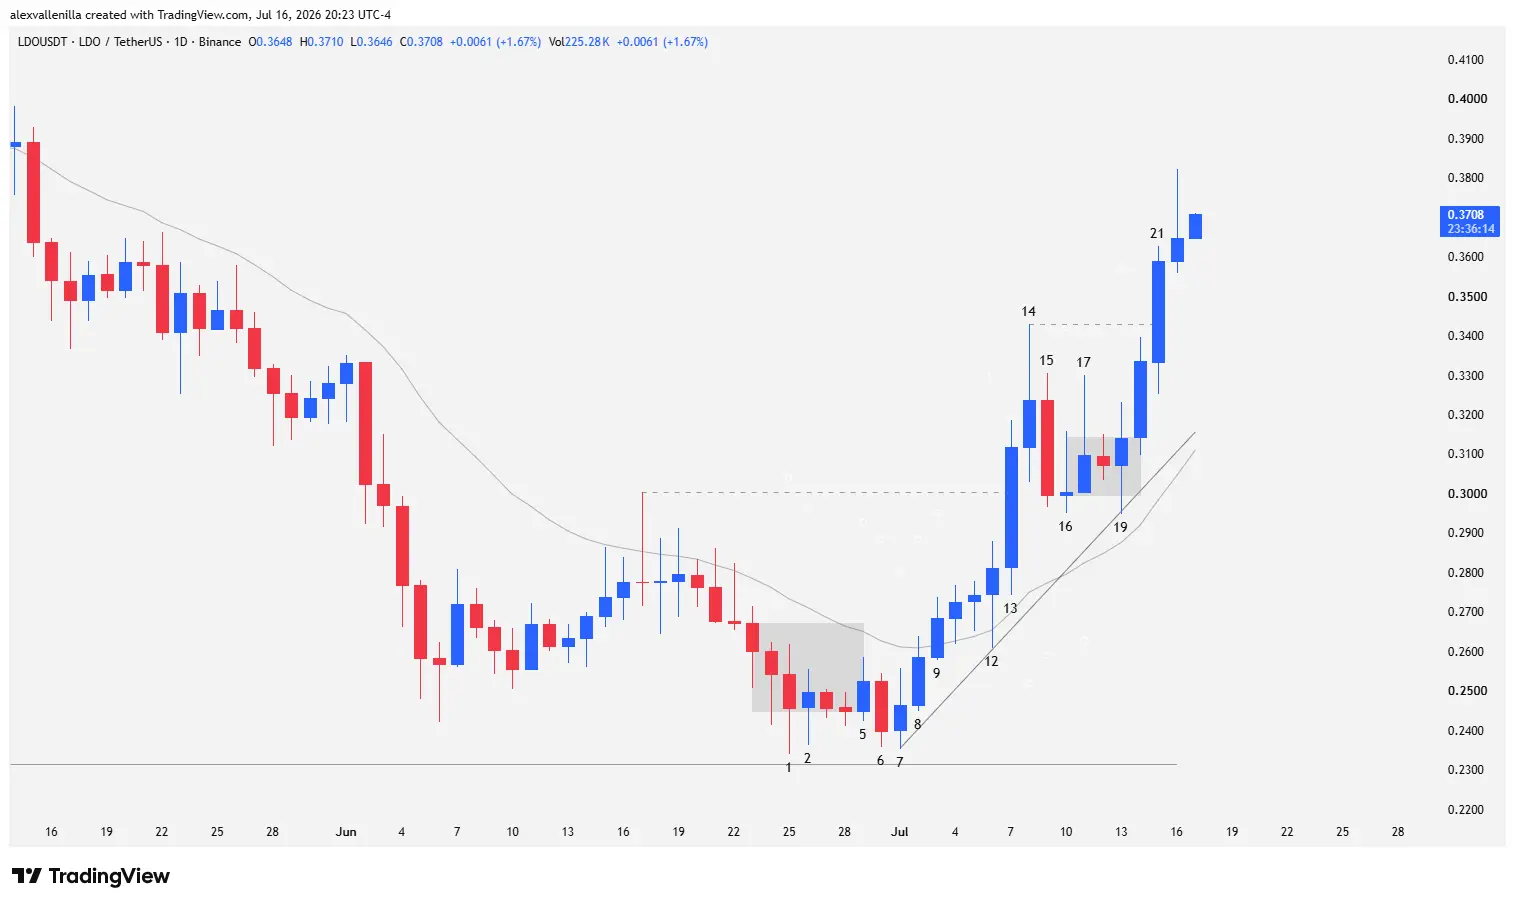
Following a prolonged bearish slumber that threatened to deepen losses for Lido (LDO), price action on its daily (1D) chart reveals a drastic shift in market psychology. Sellers’ inability to pierce historical support levels, combined with a classic bear trap, triggered a violent bullish reversal. With the 20-period exponential moving average (20 EMA) now acting as dynamic support and a two-legged structure fully underway, LDO has neutralized selling pressure and is firmly targeting the $0.44 zone, with its sights set on key macro resistance levels.
Structure and Context: Capitulation at the Abyss
LDO’s price action is unfolding within a systematic rebound supported by a short-term ascending trendline spanning the last 16 sessions. This move emerges after a two-legged decline that culminated in a failed test of the abyss.
Bears attempted, unsuccessfully, to push the price toward critical support at $0.2314—a level representing the lowest low of the long-term structural downtrend, which had gone untested for 279 bars. The subsequent formation of a dynamic double bottom between the lows of Bar 1 and Bar 7 laid the groundwork for the current rotation in order flow.
Price Action Anatomy: Bar-by-Bar
Bars 1 and 2: Exhaustion and Congestion at the Abyss: Lack of bearish follow-through.
Bar 1 prints with high volatility at the base of a prior bearish impulse. Despite the selling bias, its low fails to test key support at $0.2314. A prominent lower wick, combined with similar tails in the previous two sessions, reveals buying absorption. The body of Bar 1 overlaps entirely within the prior range, confirming that bears are losing traction. Bar 2 solidifies this scenario as a hammer-type inside bar, trapping price in a tight micro-range of indecision.
Bars 5 and 6: The Feint and the Bear Trap: Initial failed breakout.
Bar 5 attempts a bullish breakout from the congestion. However, its tiny range lacks the momentum needed to reach the 20 EMA. Sellers exploit this weakness in Bar 6, securing a close below the previous bar’s low. This threatens to resume the macro downtrend and initially marks a failed breakout of the accumulation range.
Bar 7: The Reversal Catalyst (Failed Failure): Powerful buy signal.
Bar 7 is a game-changer. Instead of continuing the bearish breakout from Bar 6, the market reacts with strong bullish force, trapping exposed sellers. It prints a highly volatile outside bar with wicks on both ends. By failing to validate the previous drop, it triggers a “failed failure” (the negation of the bearish breakout), establishing a double bottom with the low of Bar 1. This dynamic serves as a powerful buy trigger that anticipates a strong reversal.
Bars 8 and 9: Buy Trigger and High 2: Reclaiming the 20 EMA.
Bar 8 validates the reversal structure. It breaks above the 20 EMA and exceeds the high of the previous bar, completing a high-probability High 2 buy setup (the second attempt to break out of a bearish micro-channel, following the Bar 5 feint). In Bar 9, buyers take definitive control by closing convincingly above the 20 EMA, triggering pending buy orders above Bar 8.
Bars 12 and 13: Institutional Dynamite: Volume injection and conviction.
After consolidating positions, Bar 12 reintroduces volatility as an outside bar. Bears attempt to push below the 20 EMA, but demand completely absorbs supply, leaving a prominent lower tail that serves as an anchor point for the short-term ascending trendline. Right after, smart money steps in on Bar 13: a wide-range, full-bodied candle that closes above the $0.3005 resistance (the high of the broken descending trendline). This climatic expansion signals strong conviction, though it carries short-term overbought risks.
Bars 14 to 19: Cool-Off and Absorption Zone: Building dynamic support.
Bar 14 prints new local highs, but a long upper wick reveals profit-taking. Nonetheless, price refuses to retrace deeper than the midpoint of Bar 13’s body, confirming the strength of the breakout. Bears manage a temporary correction on Bar 15, but they lack follow-through in the subsequent sessions (Bars 16 to 18), where volatility contracts dramatically. On Bar 19, an outside bar tests the 16-bar ascending trendline with pinpoint accuracy, temporarily balancing market forces.
Bars 20 and 21: Takeoff and Measured Move Projection: Chasing the second bullish leg.
Bar 20 breaks out of the sideways congestion zone (the range of Bars 16–19) to the upside and surpasses the high of Bar 15, invalidating selling pressure. Finally, Bar 21 solidifies the smart money victory by closing above the high of Bar 14. This clean breakout triggers stop-losses of short sellers positioned at the top of the range, paving the way for the development of the cycle’s second bullish leg.
Technical Projection and Market Targets
The measured move of the current structure is calculated by projecting the distance of the first bullish leg (from the low of Bar 7 to the high of Bar 14) from the low of the consolidation zone. This technical projection sets a theoretical target at $0.44.
Lido’s (LDO) performance in recent sessions is a textbook example of order flow taking precedence over mathematical indicators. By sweeping sellers’ stops at lower levels and printing a “failed failure” pattern, the market established a solid accumulation base. The breakout confirmation on Bar 21 greenlights the projection toward $0.44, putting LDO in an excellent position to challenge its structural trend at the $0.47 threshold.
Disclaimer: This analysis is for informational and educational purposes only and does not, under any circumstances, constitute financial, investment, or trading advice to buy or sell digital assets. Cryptocurrencies are highly volatile assets with a risk of capital loss. Every trader must conduct their own due diligence before making market decisions.

Communications Professional. Crypto Enthusiast. Economic Journalist. Bitcoiner & Altcoiner.


